2. Introduction to Quarto
Basics of writing with Quarto
2025-07-08
Your analysis and its story 📖
Recording your data analysis story (= the choices you make) is important ⚠️
A story is not easy to extract from code:
Telling a story is not the main purpose of coding languages (it’s telling a computer what to do)
Not everybody can read code
Solution: tell your story together with your code!
Question

Literate programming
Literate programming combines programming with documentation language
Coined by Donald E. Knuth in 1984 (!)
Code follows the documentation (and not the other way around)
Story + code = notebooks
Some examples:
JupyterLab / notebook
Google colab
Rmarkdown
Quarto
Text is typically written in markdown
Code is in (executable) code chunks
Tell the story of your project
Project: a collection of code, notebooks, environments and data that serve the same analysis aim
Work in projects to:
Define goals and tasks
Organize yourself
Keep a good documentation
Communicate about methods, goals, results etc.
Word of advice: keep projects small!
Quarto projects
Documents: html, pdf and MS word
Presentations: Revealjs (html), Powerpoint (pptx) and Beamer (pdf/latex)
Websites
Books
Writing quarto
Platforms:
VSCode: most used code editor. Works well for rendering python documents.
Rstudio: code editor for R. Works well for rendering R documents.
Setup:
Start with a template (Document, Presentation, Website or Book)
Start coding!
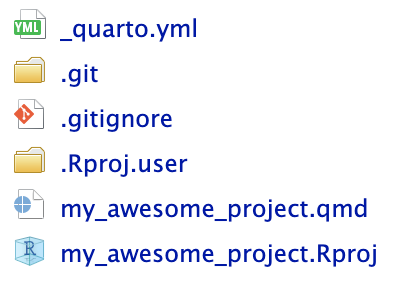
Quarto project files
_quarto.yml: YML file with project-wide settings.git: Everything required for version control with gitmy_awesome_project.Rproj: R-project based settingsmy_awesome_project.qmd: Where the work is done!

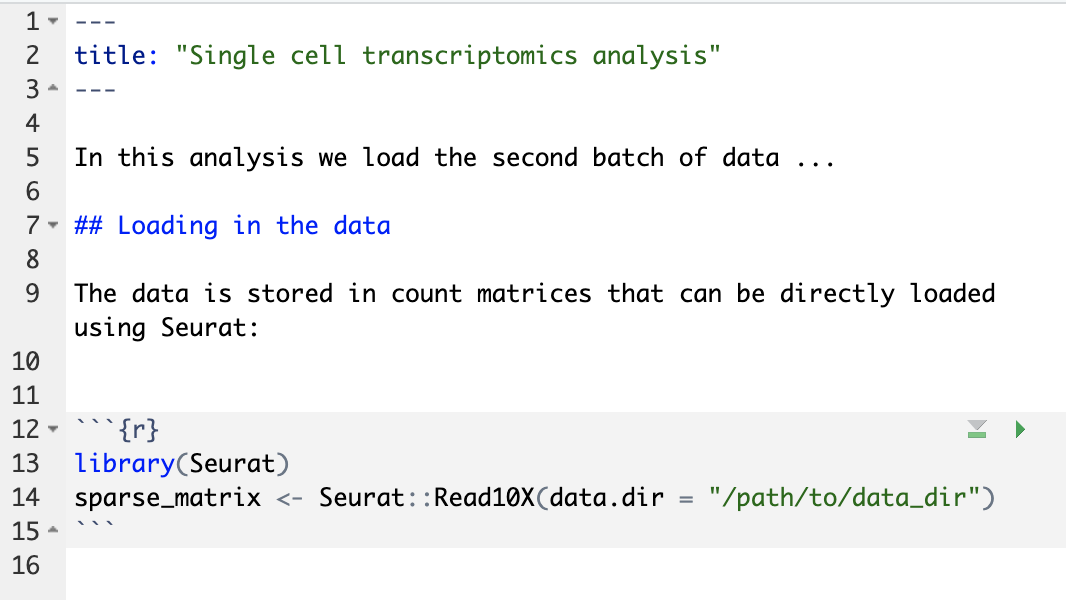
A qmd file
- Front matter (YML format):
Markdown text
Code blocks
Quarto example
Contents of my_new_analysis.qmd:

Quarto example
After rendering:

Markdown - text formatting
| Markdown Syntax | Output |
|---|---|
|
italics, bold, bold italics |
|
superscript2 / subscript2 |
|
|
|
verbatim code |
Markdown - heading
| Markdown syntax | Output |
|---|---|
|
Header 1 |
|
Header 2 |
|
Header 3 |
|
Header 4 |
Markdown - lists
Markdown - links
GO fair website
Markdown - images
As you can see from Figure 1, it is red.
Writing code - chunks

Writing code - chunks
Markdown & code - quarto magic

Figure 2: mpg versus drat
From Figure 2 you can see there is a positive correlation.
Quarto - other use cases
- Write a manuscript from source code 🎉 More info here
- Create presentations (including powerpoint exports!)
- Write your thesis in Quarto, more about books
- Maybe now is the time to get started with your personal website
More Quarto
For example:
Visual editor - have a particular look at Insert Anything
Complete overview at https://quarto.org/docs/guide/
More extensive ‘getting started’ tutorial at https://quarto.org/docs/get-started/
Exercises
Use Rstudio to:
Initiate a Quarto website project
Create a website of two pages with:
- Markdown text and images
- Code and plots
Render locally