QC and alignment
Learning outcomes
After having completed this chapter you will be able to:
- Explain how the fastq format stores sequence and base quality information and why this is limited for long-read sequencing data
- Calculate base accuracy and probability based on base quality
- Describe how alignment information is stored in a sequence alignment (
.sam) file - Perform a quality control on long-read data with
NanoPlot - Perform a basic alignment of long reads with
minimap2 - Visualise an alignment file in IGV on a local computer
Material
Exercises
1. Retrieve data
We will be working with data from:
Clark, M. B. et al (2020). Long-read sequencing reveals the complex splicing profile of the psychiatric risk gene CACNA1C in human brain. Molecular Psychiatry, 25(1), 37–47. https://doi.org/10.1038/s41380-019-0583-1
The authors used full-transcript amplicon sequencing with Oxford Nanopore Technology of CACNA1C, a gene associated with psychiatric risk.
For the exercises of today, we will work with a single sample of this study. Download and unpack the data files in your home directory.
cd ~/workdir
wget https://ngs-longreads-training.s3.eu-central-1.amazonaws.com/ngs-longreads-training.tar.gz
tar -xvf ngs-longreads-training.tar.gz
rm ngs-longreads-training.tar.gz
Exercise: This will create the directory data. Check out what’s in there.
Answer
Go to the ~/workdir/data folder:
cd ~/data
The data folder contains the following:
data/
├── reads
│   └── cerebellum-5238-batch2.fastq.gz
└── reference
    └── Homo_sapiens.GRCh38.dna.chromosome.12.fa

2 directories, 2 files
2. Quality control
We will evaluate the read quality with NanoPlot.
Exercise: Check out the manual of NanoPlot with the command NanoPlot --help, and run NanoPlot on ~/data/reads/cerebellum-5238-batch2.fastq.gz.
Hint
For a basic output of NanoPlot on a fastq.gz file you can use the options --outdir and --fastq.
Answer
We have a fastq file, so based on the manual and the example we can run:
cd ~/workdir
NanoPlot \
--fastq data/reads/cerebellum-5238-batch2.fastq.gz \
--outdir nanoplot_output
You will now have a directory with the following files:
├── Dynamic_Histogram_Read_length.html
├── Dynamic_Histogram_Read_length.png
├── HistogramReadlength.png
├── LengthvsQualityScatterPlot_dot.png
├── LengthvsQualityScatterPlot_kde.png
├── LogTransformed_HistogramReadlength.png
├── NanoPlot_20210105_1339.log
├── NanoPlot-report.html
├── NanoStats.txt
├── Weighted_HistogramReadlength.png
├── Weighted_LogTransformed_HistogramReadlength.png
└── Yield_By_Length.png
The file NanoPlot-report.html contains a report with all the information stored in the other files.
Exercise: Download NanoPlot-report.html to your local computer and answer the following questions:
A. How many reads are in the file?
B. What is the average read length? Is there a wide distribution? Given that these sequences are generated from a long-range PCR, is that expected?
C. What is the average base quality and what kind of accuracy do we therefore expect?
Download files from the notebook
You can download files from the file browser, by right-clicking a file and selecting Download:
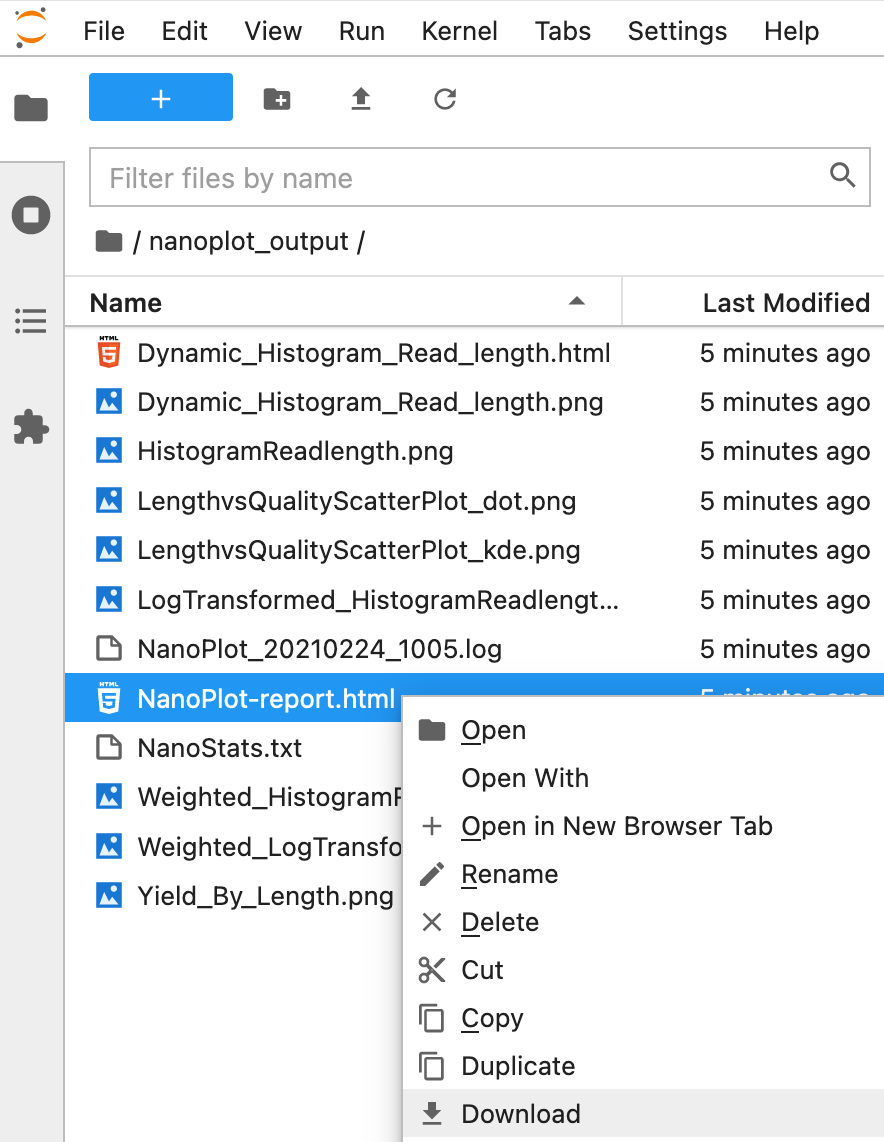
Answer
A. 3735
B. The average read length is 6,003.3 base pairs. From the read length histogram we can see that there is a very narrow distribution. As a PCR will generate sequences of approximately the same length, this is expected.
C. The average base quality is 7.3. We have learned that \(p=10^{\frac{-baseQ}{10}}\), so the average probability that the base is wrong is \(10^{\frac{-7.3}{10}} = 0.186\). The expected accuracy is \(1-0.186=0.814\) or 81.4%.
3. Read alignment
The sequence aligner minimap2 is specifically developed for (splice-aware) alignment of long reads.
Exercise: Checkout the helper minimap2 --help and/or the github readme. We are working with reads generated from cDNA. Considering we are aligning to a reference genome (DNA), what would be the most logical parameter for our dataset to the option -x?
Answer
The option -x can take the following arguments:
-x STR       preset (always applied before other options; see minimap2.1 for details) []
           - map-pb/map-ont: PacBio/Nanopore vs reference mapping
           - ava-pb/ava-ont: PacBio/Nanopore read overlap
           - asm5/asm10/asm20: asm-to-ref mapping, for ~0.1/1/5% sequence divergence
           - splice: long-read spliced alignment
           - sr: genomic short-read mapping
map-ont. However, our data is also spliced. Therefore, we should choose splice.
Introns can be quite long in mammals; up to a few hundred kb.
Exercise: Look up the CACNA1C gene in hg38 in IGV, and roughly estimate the length of the longest intron.
Hint
First load hg38 in IGV, by clicking the topleft drop-down menu:
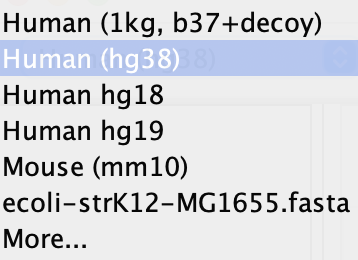
After that type CACNA1C in the search box:
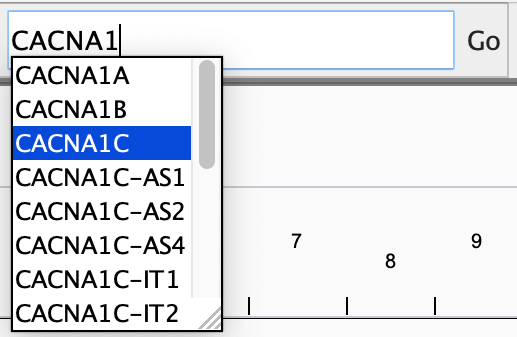
Answer
The longest intron is about 350 kilo bases (350,000 base pairs)
Exercise: Check out the -G option of minimap2. How does this relate to the the largest intron size of CACNA1C?
Answer
This is what the manual says:
-G NUM max intron length (effective with -xsplice; changing -r) [200k]
We found an intron size of approximately 350k, so the default is set too small. We should be increase it to at least 350k.
Exercise: Make a directory called alignments in your working directory. After that, modify the command below for minimap2 and run it from a script.
#!/usr/bin/env bash

cd ~/workdir

minimap2 \
-a \
-x [PARAMETER] \
-G [PARAMETER] \
-t 4 \
data/references/GRCh38.p13.chr12.fa \
data/reads/cerebellum-5238-batch2.fastq.gz \
| samtools sort \
| samtools view -bh > alignments/cerebellum-5238-batch2.bam

## indexing for IGV
samtools index alignments/cerebellum-5238-batch2.bam
Note
Once your script is running, it will take a while to finish. Have a ☕.
Answer
Make a directory like this:
mkdir ~/workdir/alignments
Modify the script to set the -x and -G options:
#!/usr/bin/env bash

cd ~/workdir

minimap2 \
-a \
-x splice \
-G 500k \
-t 4 \
data/reference/Homo_sapiens.GRCh38.dna.chromosome.12.fa \
data/reads/cerebellum-5238-batch2.fastq.gz \
| samtools sort \
| samtools view -bh > alignments/cerebellum-5238-batch2.bam

## indexing for IGV
samtools index alignments/cerebellum-5238-batch2.bam
And run it (e.g. if you named the script ont_alignment.sh):
chmod u+x ont_alignment.sh
./ont_alignment.sh
4. Visualisation
Let’s have a look at the alignments. Download the files cerebellum-5238-batch2.bam and cerebellum-5238-batch2.bam.bai to your local computer and load the .bam file into IGV (File > Load from File…).
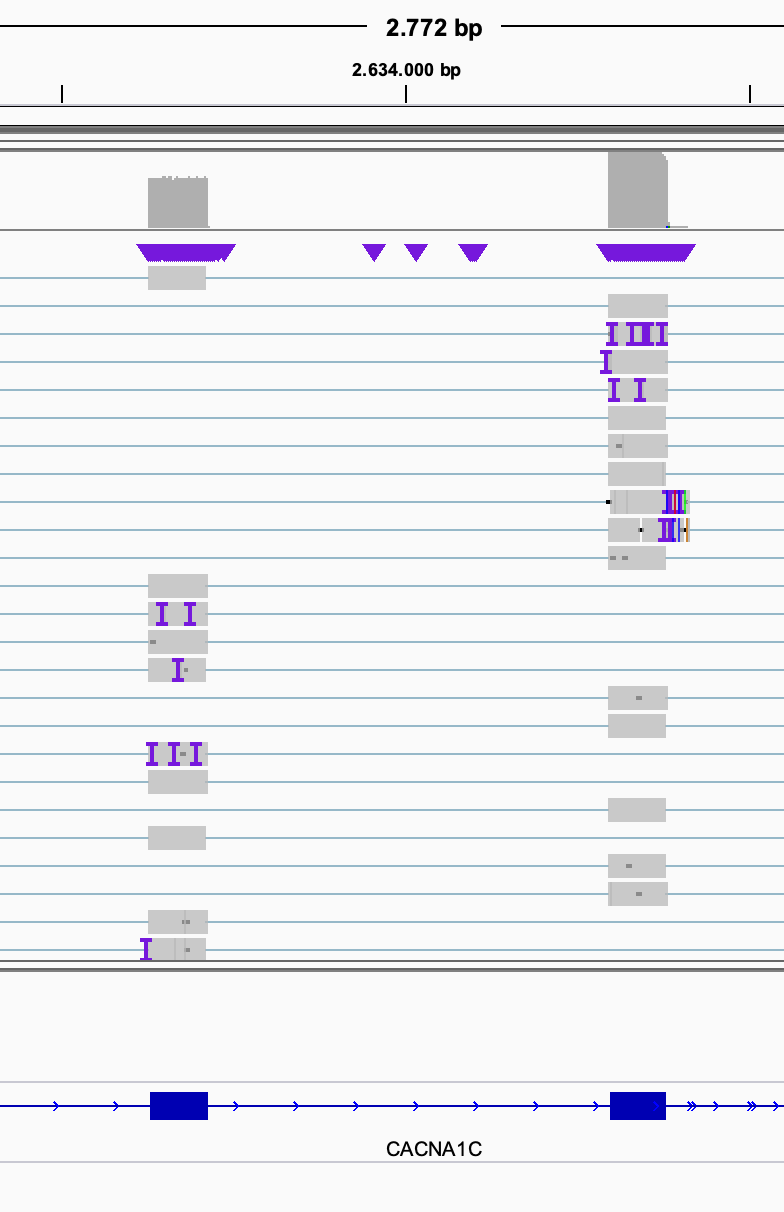
Exercise: Have a look at the region chr12:2,632,655-2,635,447 by typing it into the search box. Do you see any evidence for alternative splicing already?
Answer
The two exons seem to be mutually exclusive: