Enrichment analysis
Once the reads have been mapped and counted, one can assess the differential expression of genes between different conditions.
During this lesson, you will learn to :
- perform downstream analysis on gene sets, such as annotation (e.g. GO terms or Reactome pathways) over-representation.
Material
clusterProfiler vignette/e-book
Downstream analysis : over-representation analysis
Having lists of differentially-expressed genes is quite interesting in itself, however when there are many DE genes, it can be interesting to map these results onto curated sets of genes associated with known biological functions.
Here, we propose to use clusterProfiler, which regroups several enrichment detection algorithms onto several databases.
We recommend you get inspiration from their very nice vignette/e-book to perform your own analyses.
If you do not have a list of DE genes from your previous analysis, you may use the following table:
The proposed correction will concern these.
Ruhland2016 analysis with clusterProfiler
We begin by reading the results of the DE analysis. Adapt this to your own analysis. Beware that edgeR and DESeq2 use different column names in their result tables (log2FoldChange/logFC , padj/FDR).
library(AnnotationHub)
library(AnnotationDbi)
library(clusterProfiler)
library(ReactomePA)

library(org.Mm.eg.db)


res = read.csv( 'Ruhland2016.DESeq2.results.csv'  , row.names=1)
#let's define significance as padj <0.01 & abs(lfc) > 1
res$sig = abs(res$log2FoldChange)>1 & res$padj<0.01

table( res$sig )
Number of non-significant/significant genes
 FALSE  TRUE
 17370   391
Translating gene ENSEMBL names to their entrezID (this is what clusterProfiler uses), as well as Symbol (named used by most biologist).
genes_universe <- bitr(rownames(res), fromType = "ENSEMBL",
                       toType = c("ENTREZID", "SYMBOL"),
                       OrgDb = "org.Mm.eg.db")

head( genes_universe )

#ENSEMBL ENTREZID  SYMBOL
#2 ENSMUSG00000033845    27395  Mrpl15
#4 ENSMUSG00000025903    18777  Lypla1
#5 ENSMUSG00000033813    21399   Tcea1
#7 ENSMUSG00000002459    58175   Rgs20
#8 ENSMUSG00000033793   108664 Atp6v1h
#9 ENSMUSG00000025907    12421  Rb1cc1

dim(genes_universe)
# 15443     3

length(rownames(res))
# 18012
genes_DE <- bitr(rownames(res)[which( res$sig==T )], fromType = "ENSEMBL",
                 toType = c("ENTREZID", "SYMBOL"),
                 OrgDb = "org.Mm.eg.db")
dim(genes_DE)
# 382   3
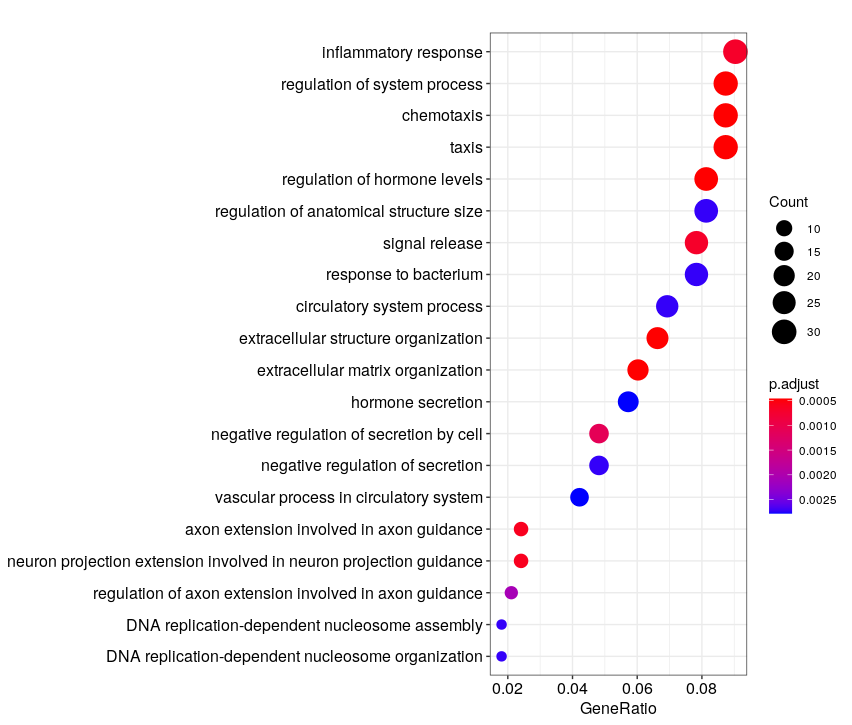
# GO "biological process (BP)" enrichment
ego_bp <- enrichGO(gene          = as.character(unique(genes_DE$ENTREZID)),
                   universe      = as.character(unique(genes_universe$ENTREZID)),
                   OrgDb         = org.Mm.eg.db,
                   ont           = "BP",
                   pAdjustMethod = "BH",
                   pvalueCutoff  = 0.01,
                   qvalueCutoff  = 0.05,
                   readable      = TRUE)
# couple of minutes to run

head(ego_bp)
dotplot(ego_bp, showCategory = 20)
# sample plot, but with adjusted p-value as x-axis
#dotplot(ego_bp, x = "p.adjust", showCategory = 20)
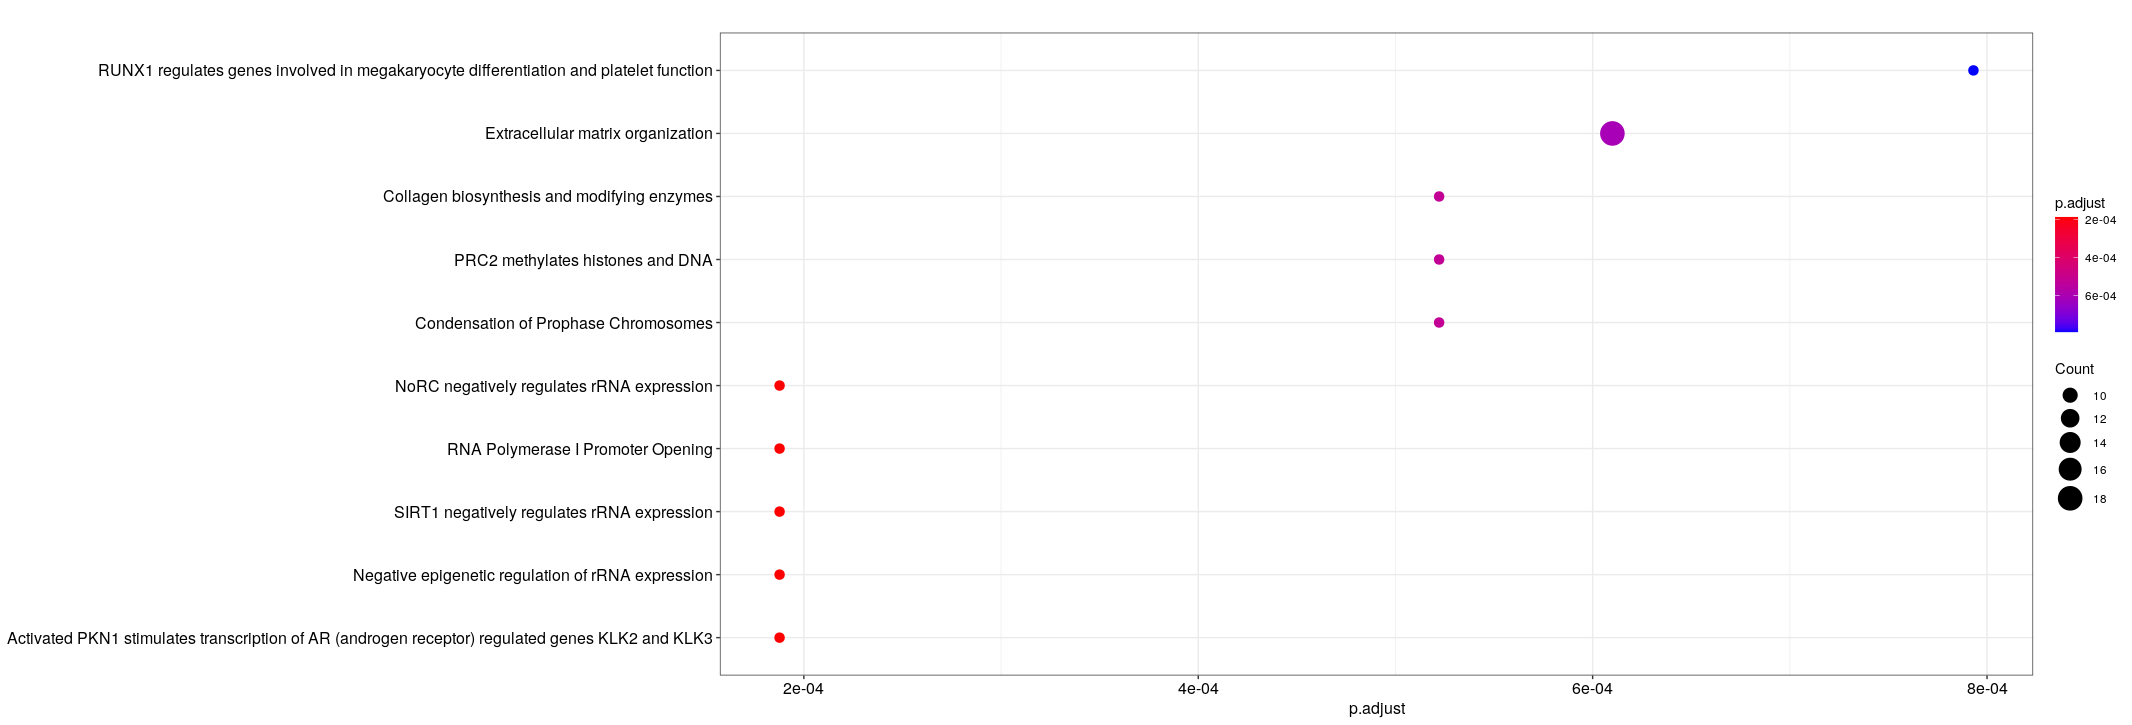
# Reactome pathways enrichment
reactome.enrich <- enrichPathway(gene=as.character(unique(genes_DE$ENTREZID)),
                                 organism = "mouse",
                                 pAdjustMethod = "BH",
                                 qvalueCutoff = 0.01,
                                 readable=T,
                                 universe = genes_universe$ENTREZID)
# <1 minute to run


dotplot(reactome.enrich, x = "p.adjust")