BUSCO - the what, why, and how!
Aim
Use BUSCO to assess the quality of different types of genomic data.
Learning outcomes
- What are the different BUSCO modes and when should you use them?
- What are the BUSCO outputs and where to find them?
Introduction
In 2013 I was working on producing genome assemblies for 16 Anopheles mosquitoes, back then we only had short-read technologies and we needed to find a way to assess the quality of the genomes we were producing. I therefore started developing what eventually became BUSCO, now one of the most widely used tools in genomics for assessing the quality of genome assemblies and annotations in terms of gene completeness.
Assessing genome assemblies for completeness
Before we download any genomics data, let’s create a working directory for this exercise, starting by opening a terminal on the Workspace if you’ve not already got one open. Then, from the /workspace/biodivinfo/ directory, create a new directory (mkdir) and navigate into the new directory (cd):
cd /workspace/biodivinfo/
mkdir Session1
cd Session1/
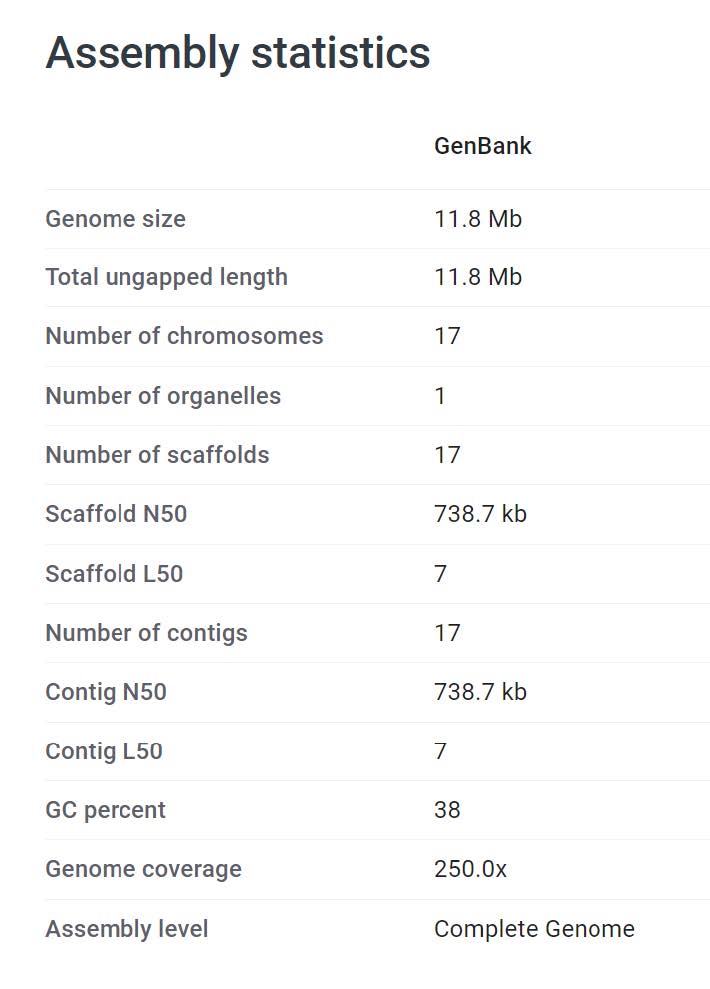
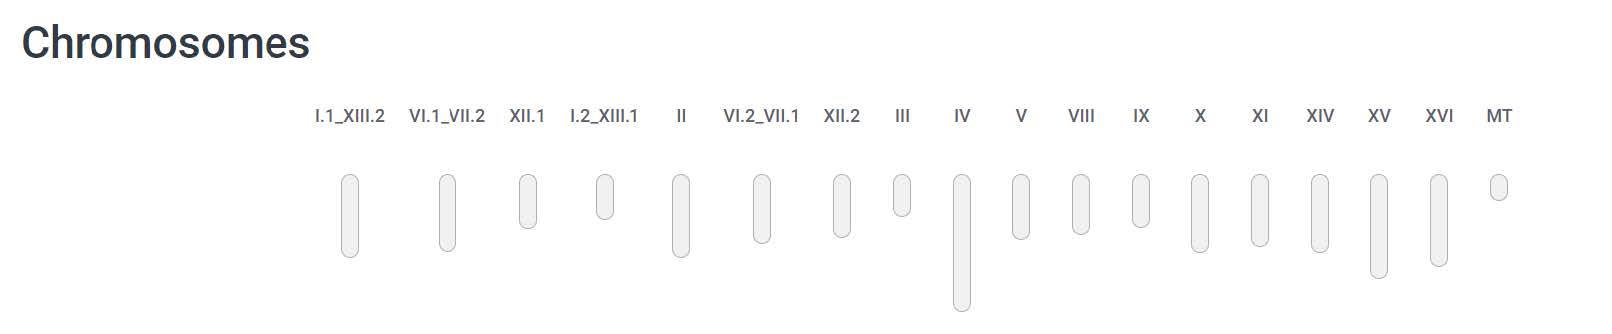
Now we can fetch some genome data that we wish to assess. We will work on a small genome so that it does not take too long to run the analyses, hence I have chosen Saccharomyces jurei, a newly discovered fungal species with a small genome of 12 Mbps (GenBank assembly GCA_900290405.1) that can be found on the NCBI.
The summary statistics are already provided by the NCBI, but not the BUSCO evaluations:
Questions:
- What is the “Scaffold N50” and what does it mean?
- What is the “Scaffold L50” and what does it mean?
Answer
The N50 is the shortest contig length that needs to be included for covering 50% of the genome. The L50 is the count of smallest number of contigs whose length sum makes up half of a genome size. More information here.
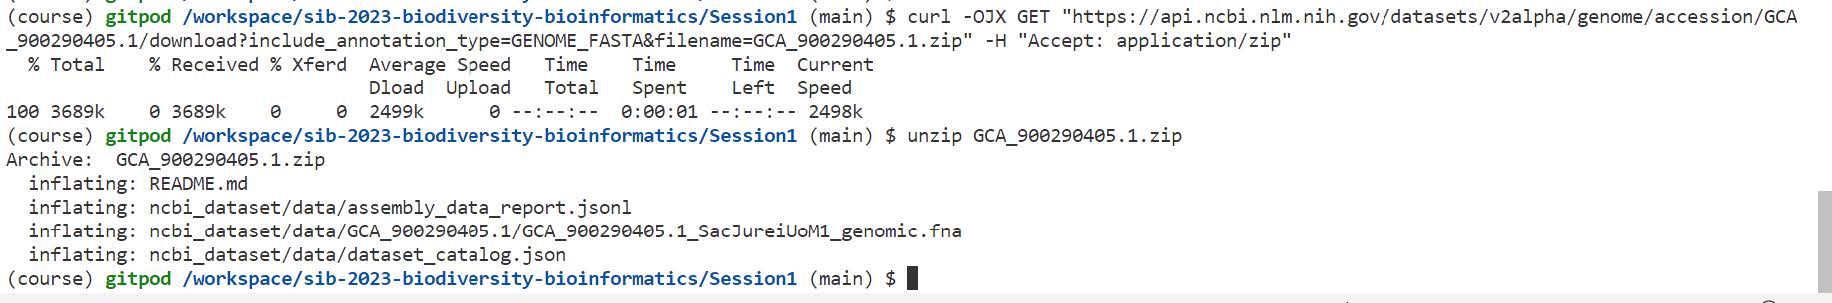
We will use the curl command and the NCBI Datasets framework to fetch the genome assembly in FASTA format and then unzip the downloaded file:
curl -OJX GET "https://api.ncbi.nlm.nih.gov/datasets/v2alpha/genome/accession/GCA_900290405.1/download?include_annotation_type=GENOME_FASTA&filename=GCA_900290405.1.zip" -H "Accept: application/zip"
unzip GCA_900290405.1.zip
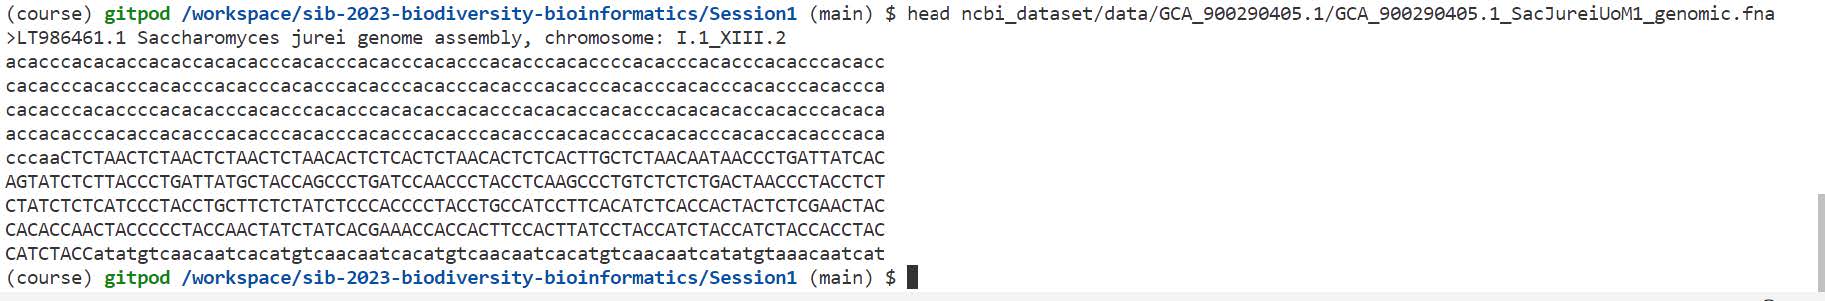
We will take a look at the first few lines of the FASTA file:
head ncbi_dataset/data/GCA_900290405.1/GCA_900290405.1_SacJureiUoM1_genomic.fna
Now we have the genome, we can run BUSCO assessments in the genome mode to quantify gene completeness of this genome assembly.

The four main required input options for us therefore are:
-i ncbi_dataset/data/GCA_900290405.1/GCA_900290405.1_SacJureiUoM1_genomic.fna-o SacJurei-m genome-l eukaryota_odb10
We will also specify the job to use 4 CPUs in order to speed up the task: -c 4
The whole command will thus be:
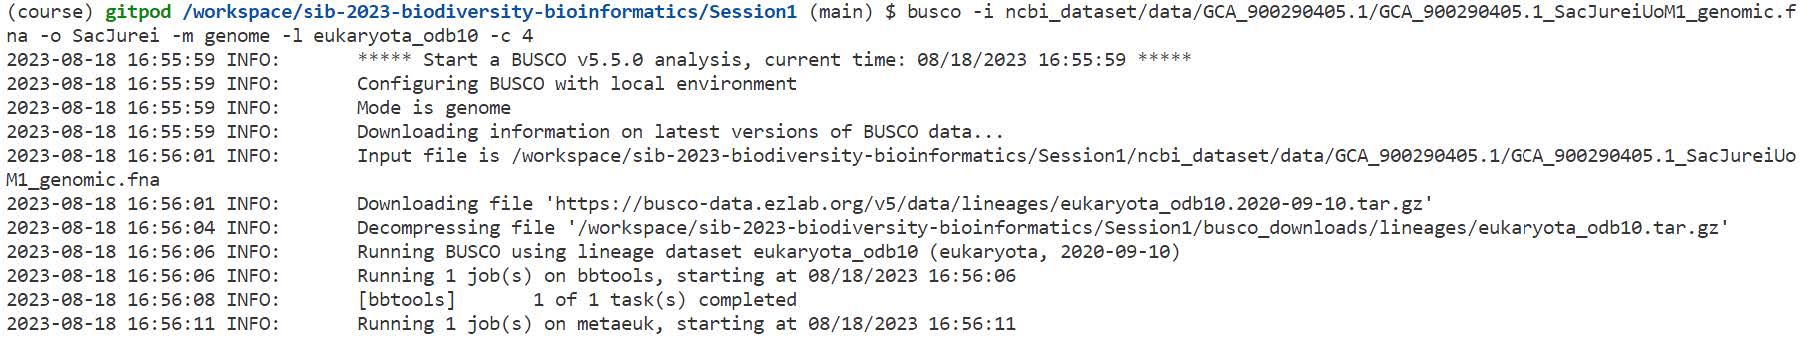
busco -i ncbi_dataset/data/GCA_900290405.1/GCA_900290405.1_SacJureiUoM1_genomic.fna -o SacJurei -m genome -l eukaryota_odb10 -c 4
On the terminal you can see which steps BUSCO is executing:
- Configuration
- Dataset download
- Metaeuk: this is the default “gene finding” approach
Question: What other “gene finding” approaches are possible to use with BUSCO?
Answer
2 other gene finding approaches are implemented in BUSCO: Augustus (--augustus flag) and Miniprot (--miniprot flag).
Which BUSCO lineage to choose?
We used the “eukaryota” dataset:
- eukaryota_odb10: 255 BUSCOs
- fungi_odb10: 758 BUSCOs
- ascomycota_odb10: 1706 BUSCOs
- saccharomycetes_odb10: 2137 BUSCOs
- ascomycota_odb10: 1706 BUSCOs
- fungi_odb10: 758 BUSCOs
Question: Why would you want to use a more specific or a less specific lineage dataset for your BUSCO evaluations?
Answer
Testing a genome with a more specific lineage dataset will make BUSCO look for clade-specific genes and thus will find more genes. Testing with a less specific lineage dataset will make BUSCO look for genes that are present in a lot of species, thus restricting the number of genes. These genes usually have key functions such as transcription, translation…
The analysis continues with the following steps being printed to the terminal:
- Once metaeuk (first round) is completed, then
- The hmmsearch step follows

Question: What is the hmmsearch step doing?
Answer
It searches for sequence homologs between the BUSCO database and the genome to evaluate.
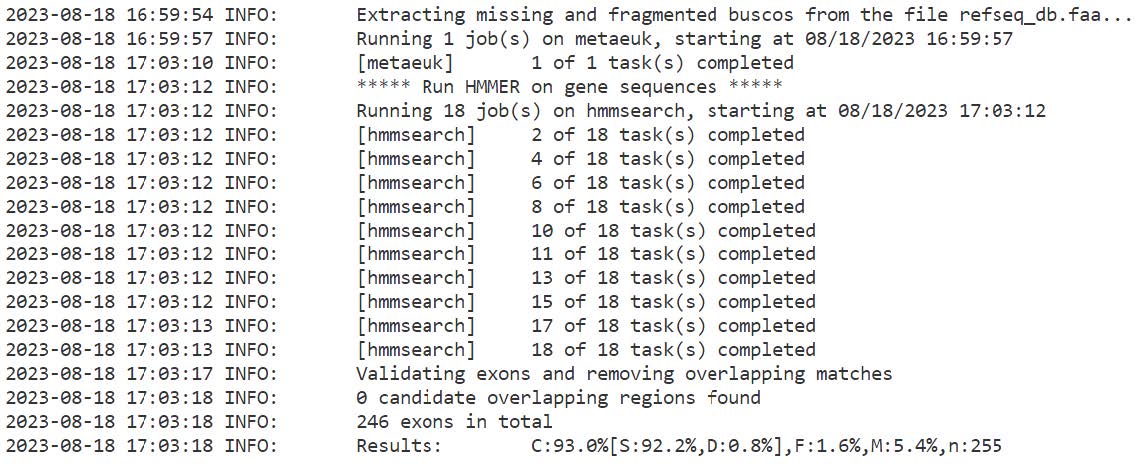
The analysis continues with the following steps being printed to the terminal:
- The extraction of missing and fragmented buscos
- A second round of metaeuk predictions
- Then a second round of hmmsearch follows
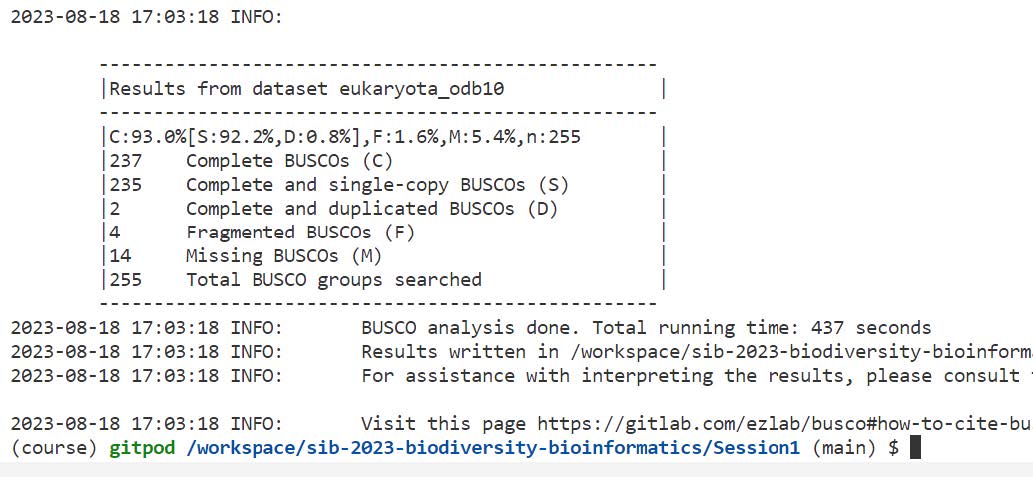
- To finally give the results
The analysis should take about 8 minutes to complete.
If BUSCO failed, you can get the file from the folder with data files for the practical instead
cp /workspace/biodivinfo/data/Session1/SacJurei.zip .
unzip SacJurei.zip
Let’s explore the results of a typical genome assembly assessment run:
ls -l SacJurei/
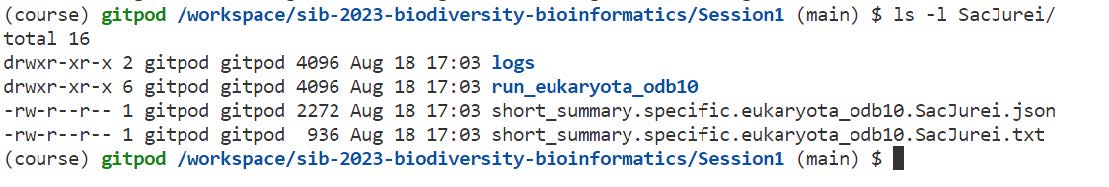
Here’s a short summary of the files created by BUSCO:
- logs: useful if something went wrong
- short_summary.specific.eukaryota_odb10.SacJurei.txt: open the file in the text editor (pink, explorer)
- Indicates the lineage dataset that was used (blue)
- Summarises the main results (green)
- Provides some assembly statistics (yellow)
- Lists the versions of all the tools used during this run (orange)
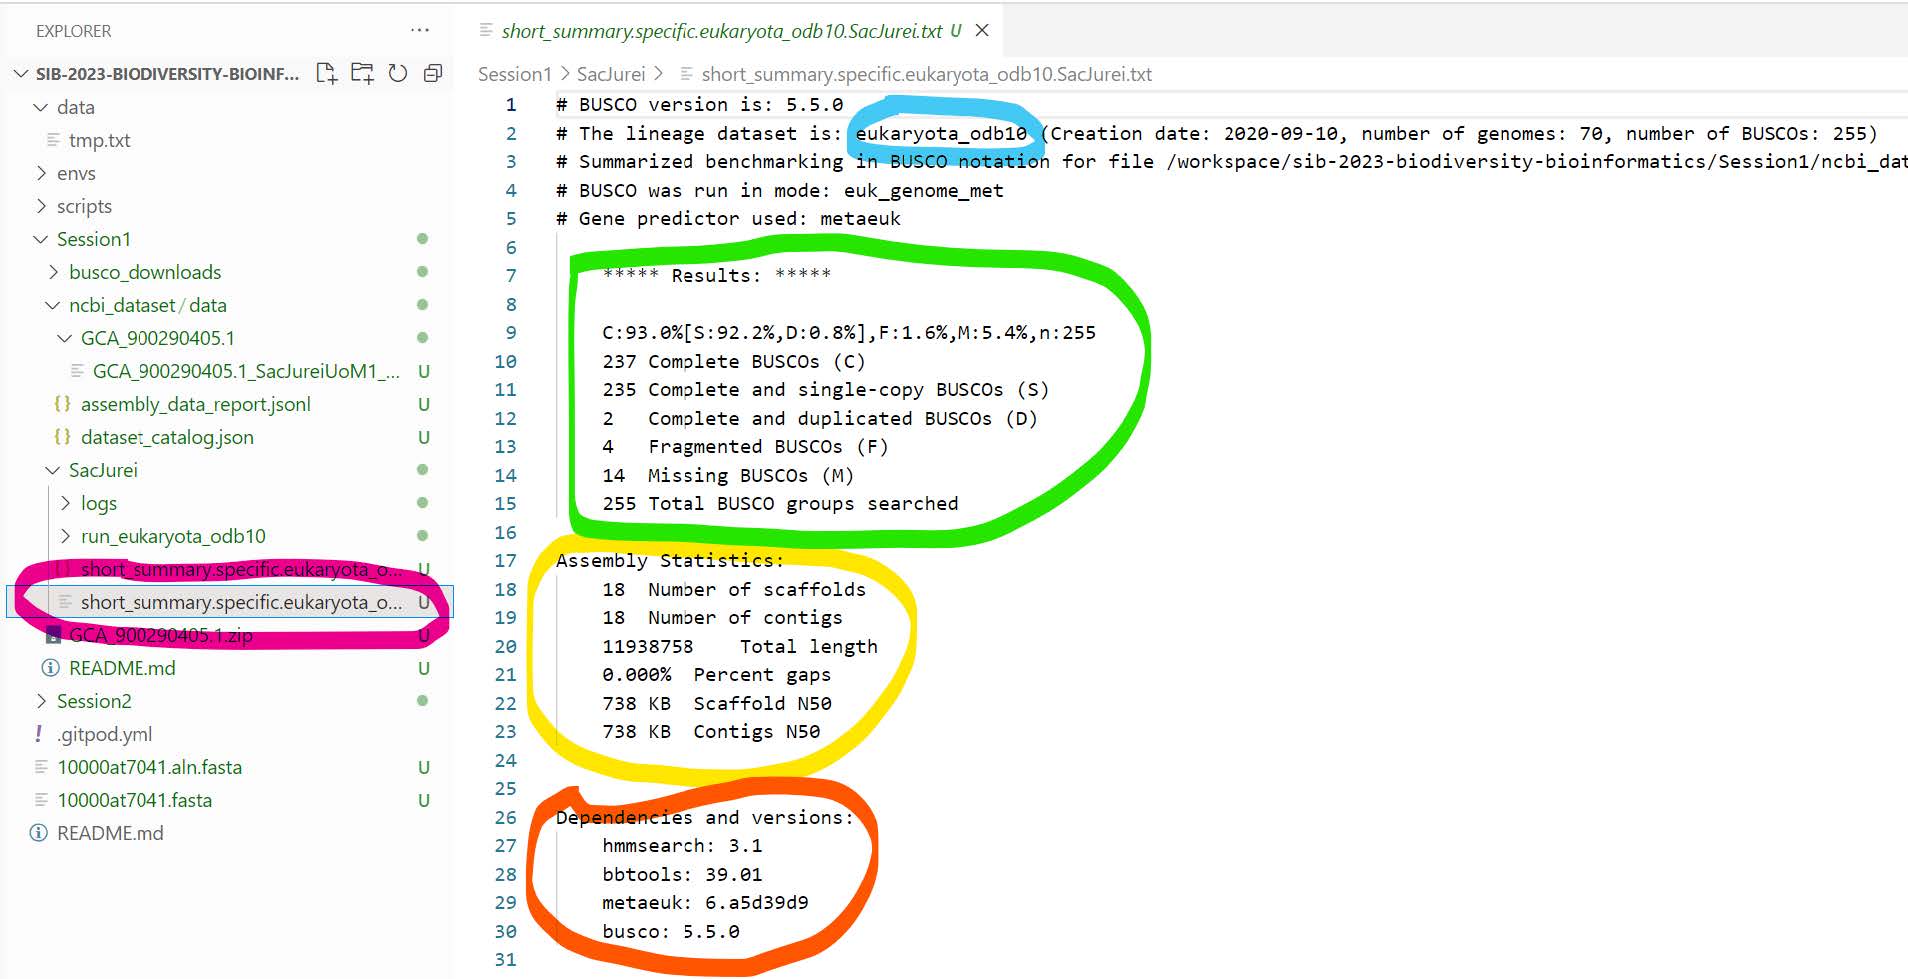
- short_summary.specific.eukaryota_odb10.SacJurei.json: JSON version of the previous file
-
run_eukaryota_odb10: folder with the full results from the run
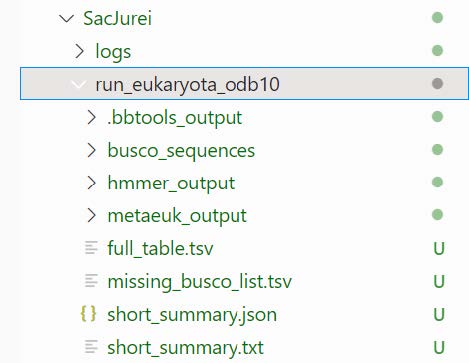
- busco_sequences:: PROTEIN and DNA sequences provided
- fragmented_busco_sequences
- multi_copy_busco_sequences
- single_copy_busco_sequences
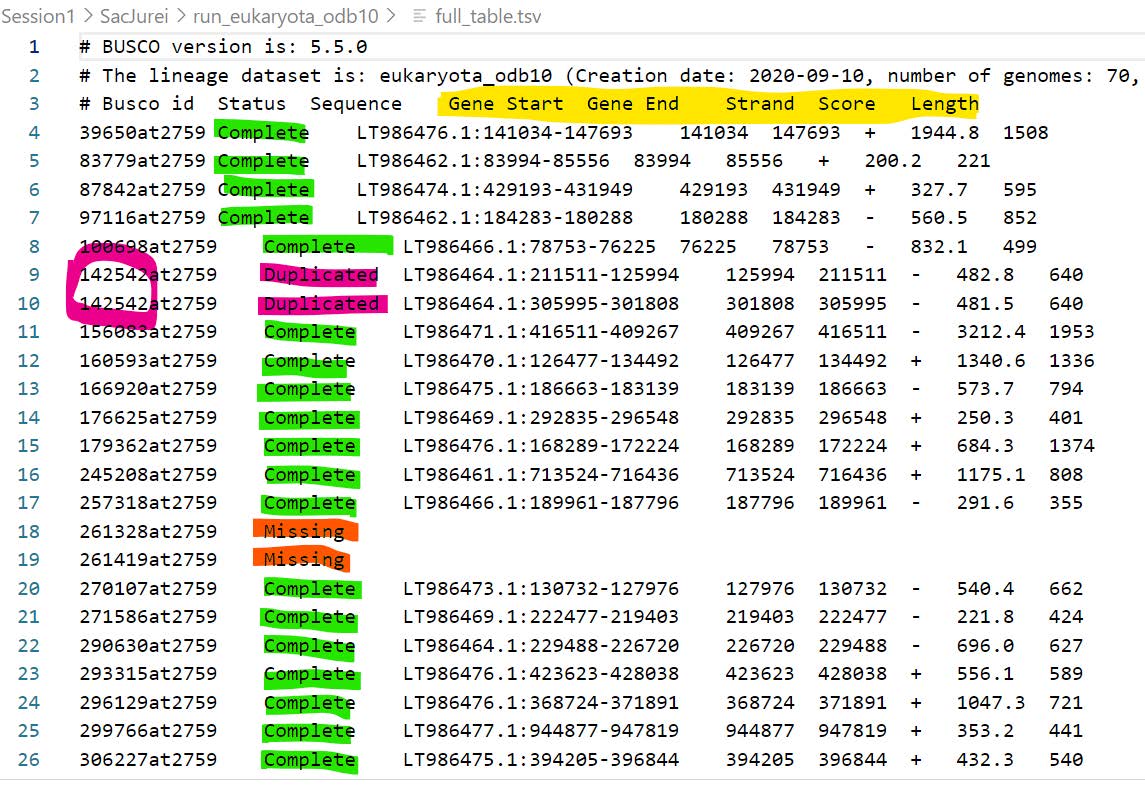
- full_table.tsv: details of status (Complete, Duplicated, Fragmented, or Missing), genomic locations, scores, and lengths of all searched BUSCOs
- hmmer_output: searching predicted proteins against BUSCO profiles
- initial_run_results
- Rerun_results
- metaeuk_output: the gene prediction results
- combined_nucl_seqs.fas
- combined_pred_proteins.fas
- initial_results
- refseq_db_rerun.faa
- Rerun_results
- missing_busco_list.tsv: the BUSCOs that were never found
- busco_sequences:: PROTEIN and DNA sequences provided
Let’s plot the results of a typical genome assembly assessment run. BUSCO provides R scripts to produce basic plots that summarise the results. Normally you would want to summarise the results from several assessments, e.g. the same genome with different lineage datasets, or different versions of your genome assembly build with different workflows/parameters, or the assessments of the genome assemblies of several species side-by-side.
Therefore we need to copy our short summary file into a new folder:

mkdir BUSCO_summaries
cp SacJurei/short_summary.specific.eukaryota_odb10.SacJurei.txt BUSCO_summaries/
Note
Make sure you are still in the Session1 directory! You can use the command pwd to check where you are located.
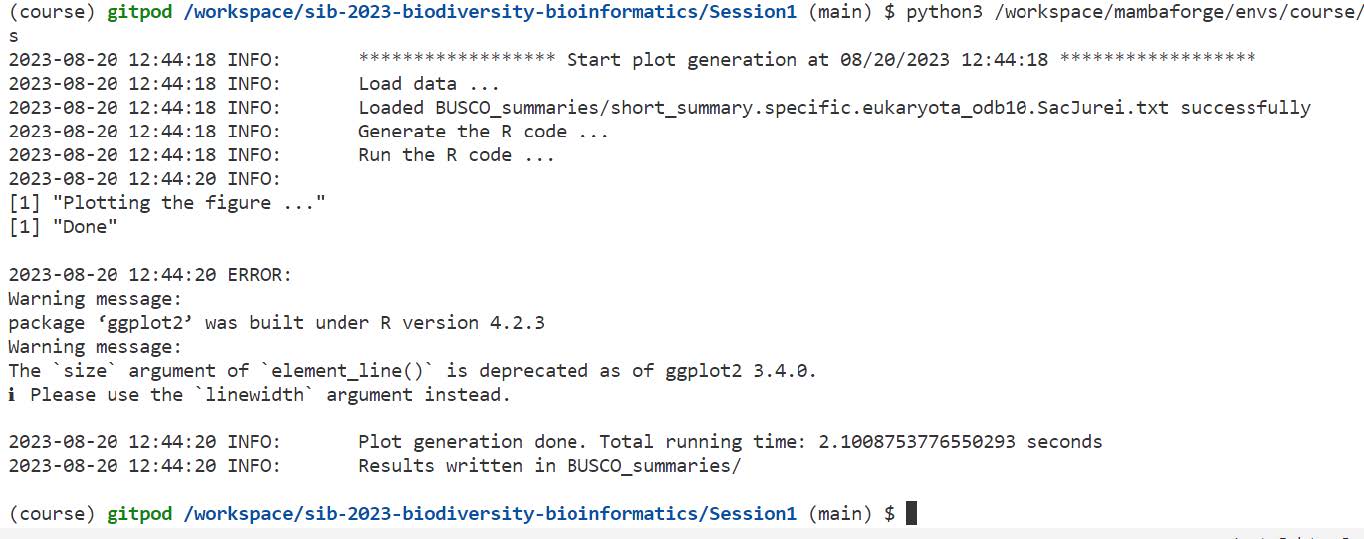
Run the python script to plot the summary:
python3 /workspace/mambaforge/envs/course/bin/generate_plot.py -wd BUSCO_summaries
Note
This command will produce some warnings and errors but you can ignore them - they are caused by an argument deprecation in the ggplot2 R package.
Open the resulting plot file (busco_figure.png) using the explorer (left panel of the window). You can zoom in/out by using Ctrl + scroll up/down (mousewheel) on the figure.

Let’s check some of these apparently missing BUSCOs:
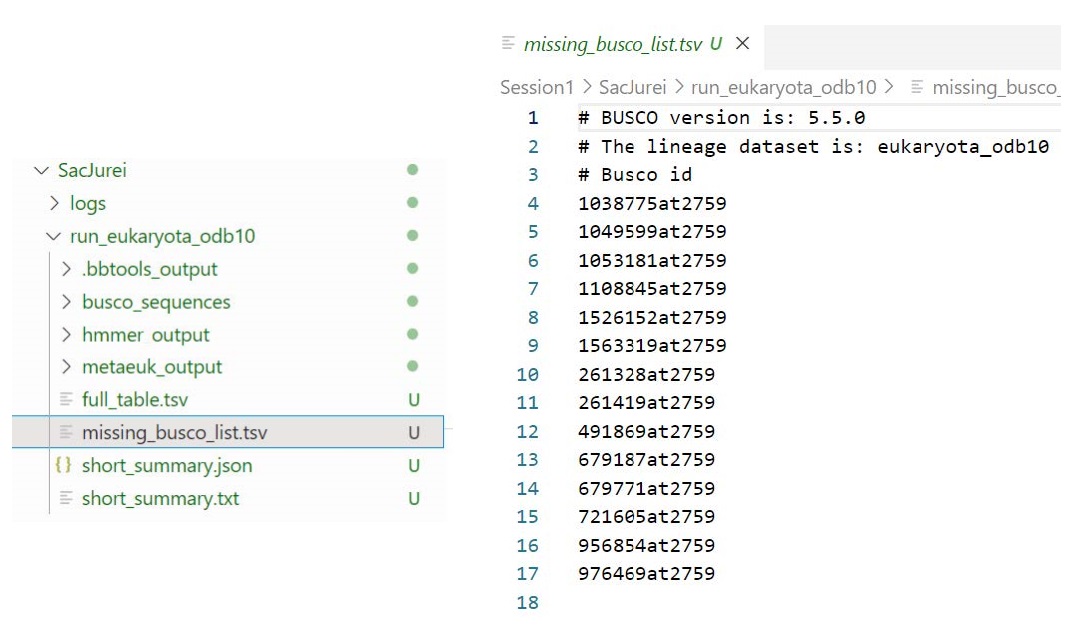
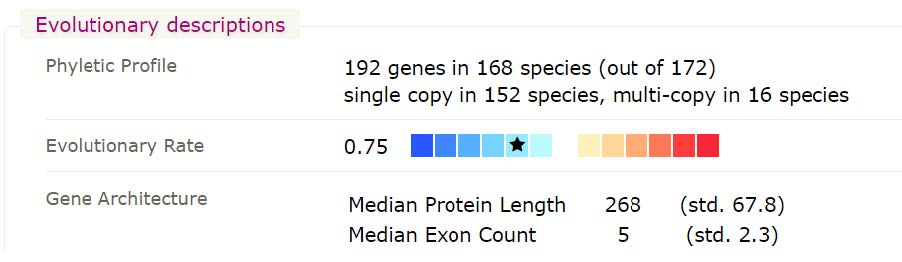
Search OrthoDB v10 for the missing BUSCO, 1038775at2759:
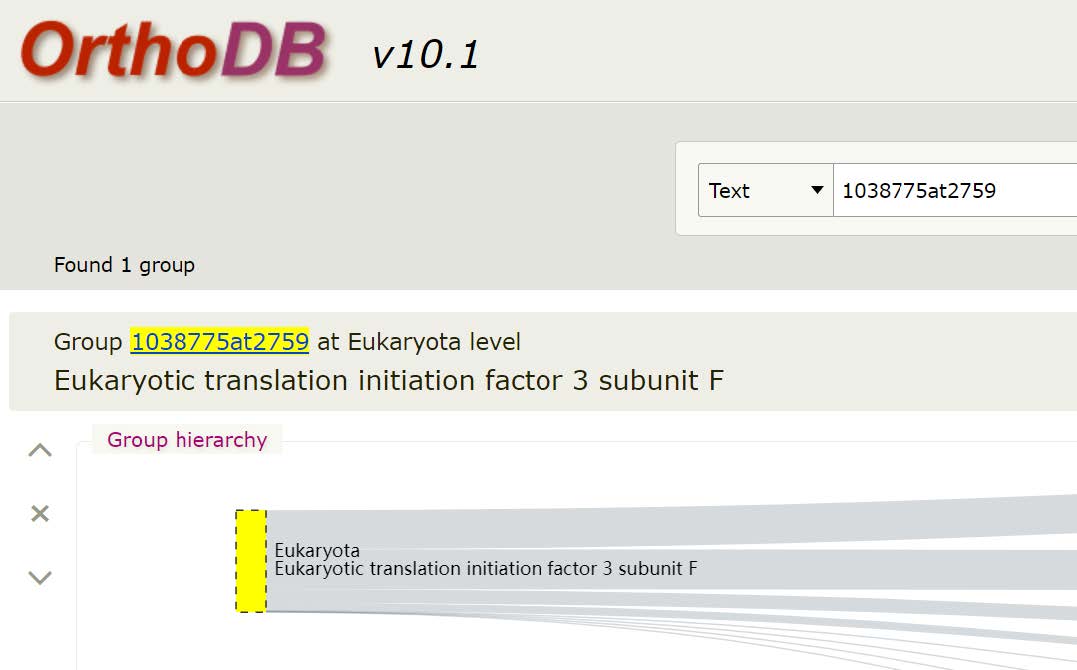
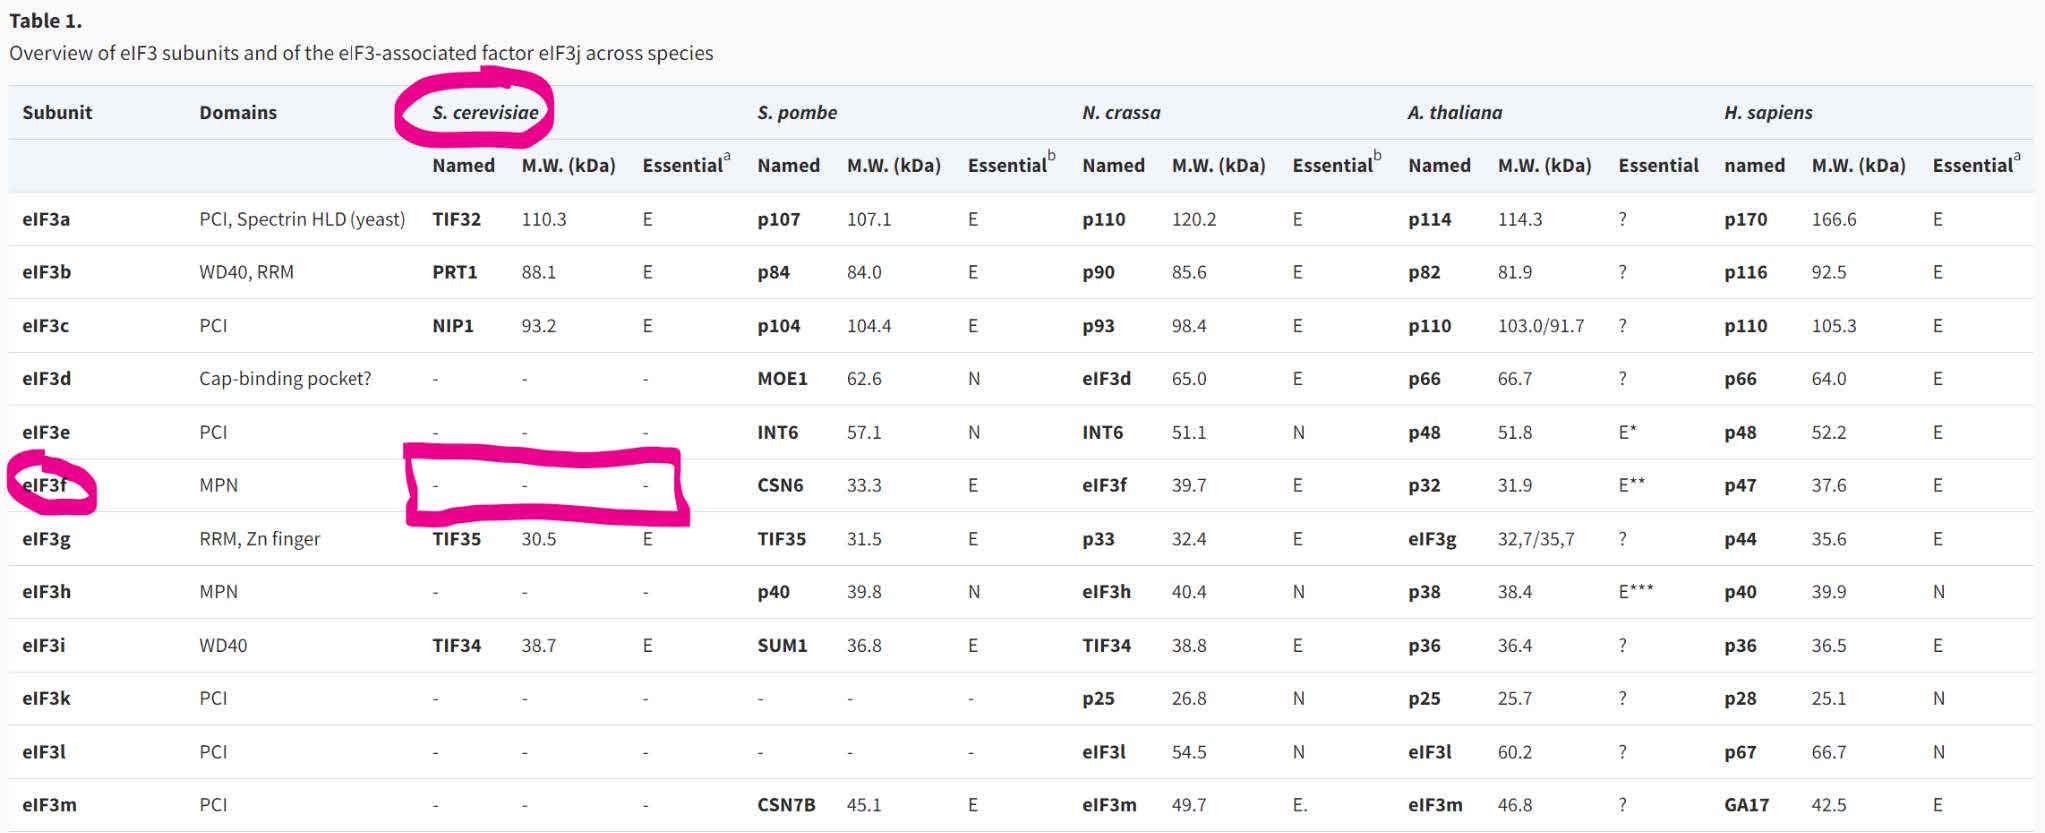
This gene is the Eukaryotic translation initiation factor 3 subunit F. It has orthologues in 91% of eukaryotes at OrthoDB v10. Of these, it is single-copy in 89%.
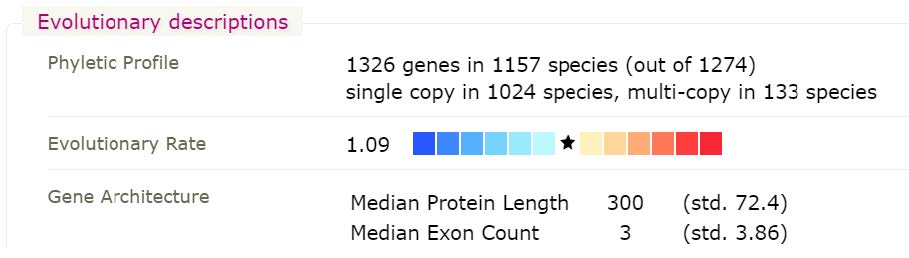
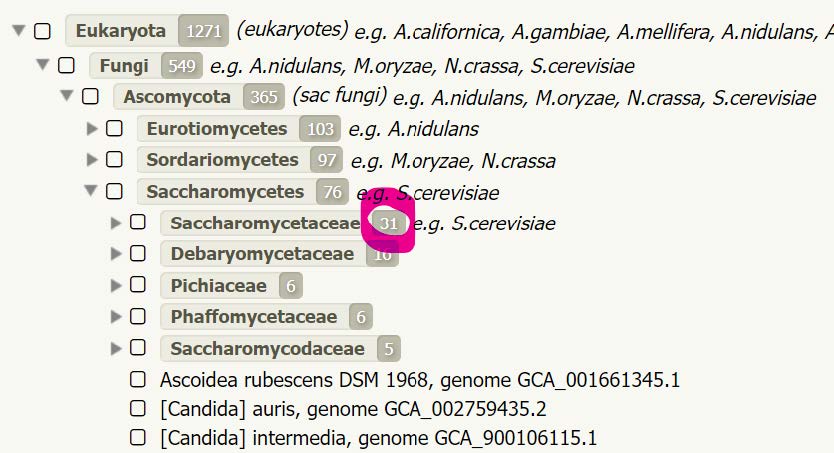
Checking other Saccharomyces species at OrthoDB in the same orthogroup, 1038775at2759, reveals that only one species of Saccharomycetaceae seems to have an orthologue of Eukaryotic translation initiation factor 3 subunit F.

This is despite the fact that OrthoDB v10 contains 31 species of Saccharomycetaceae, strongly suggesting a real evolutionary loss of this otherwise highly conserved gene.
This has been recognised in the literature, and indeed two of the other missing BUSCOs are the group of Subunit H orthologues, 976469at2759, and the group of Subunit M orthologues, 679771at2759.
Assessing genome annotations for completeness
Next we will run an assessment of an annotated protein set, i.e. “proteins” mode.
Question: What is the difference between “proteins” mode and “transcriptome” mode?
Answer
The “proteins” mode assesses a gene set, while the “transcriptome” mode assesses assembled transcripts, which requires either tBLASTn (for prokaryotes) or Metaeuk (for eukaryotes).
For this exercise we will look at the human body louse, Pediculus humanus corporis (GenBank assembly GCF_000006295.1) that can be found on the NCBI. The NCBI reports a total of 10‘773 protein-coding genes, which is a somewhat small number of genes compared to many other insect genomes.

We will use the curl command and the NCBI Datasets framework to fetch the genome annotations file in FASTA format and then unzip the downloaded file:
curl -OJX GET "https://api.ncbi.nlm.nih.gov/datasets/v2alpha/genome/accession/GCF_000006295.1/download?include_annotation_type=PROT_FASTA&filename=GCF_000006295.1.zip" -H "Accept: application/zip"
unzip GCF_000006295.1.zip
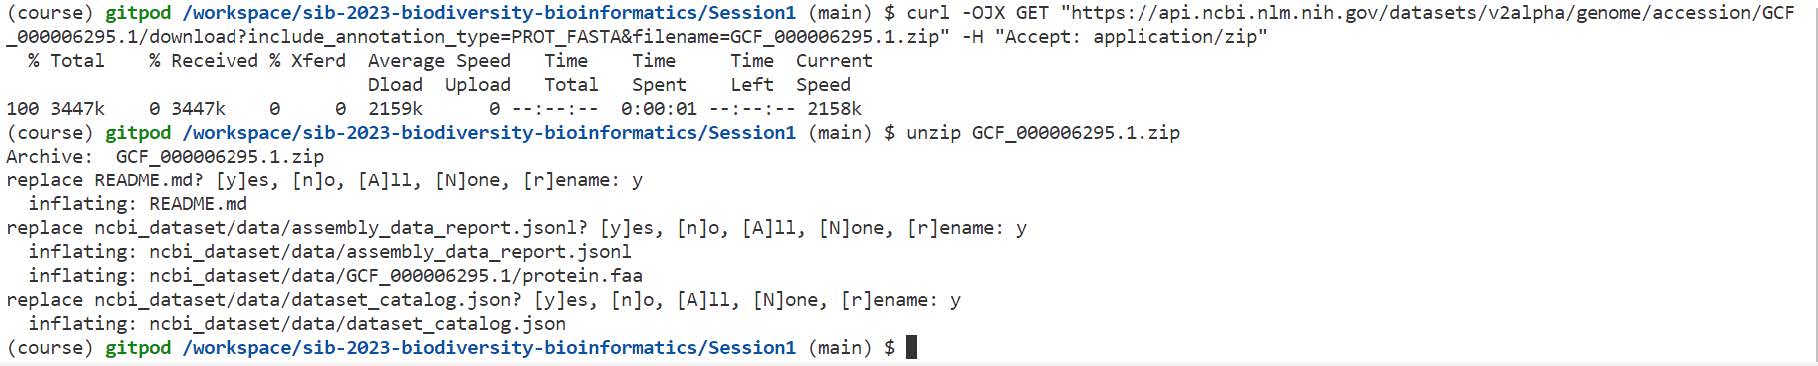
Hint
If the prompt asks if you wish to replace some files, just say yes, type A and then enter return (this is because we previously downloaded a genome from NCBI).
The four main required input options for us therefore are:
-i ncbi_dataset/data/GCF_000006295.1/protein.faa-o Pediculus-m proteins-l arthropoda_odb10
We will also specify the job to use 4 CPUs in order to speed up the task: -c 4
The whole command will thus be:
busco -i ncbi_dataset/data/GCF_000006295.1/protein.faa -o Pediculus -m proteins -l arthropoda_odb10 -c 4
The job starts by configuring the environment, then fetching the “arthropoda_odb10” lineage dataset, and then launching the hmmsearch jobs:

Question: Why does BUSCO this time go directly into the hmmsearch steps and not start with the gene prediction (metaeuk) steps?
Answer
The genes are already annotated, hence there is no need to predict them.
When the 1013 searches are complete, the final results are displayed:

Question: Despite the “low” number of genes in this genome, what can we say about the completeness of this annotation set?
Answer
This annotation set seems very complete, with a lot of single-copy BUSCOs (96.4%) and very few duplicated (0.3%) or missing (0.8%) BUSCOs.
If BUSCO failed, you can get the file from the folder with data files for the practical instead
cp /workspace/biodivinfo/data/Session1/Pediculus.zip .
unzip Pediculus.zip
Use the explorer to see the output files and folders. Although they are similar to when we ran a genome assembly assessment, note this time there are no “metaeuk” results folders, only the sequences and the hmmer_output, along with the table, list and summary files.

If you want, you can once again plot the results of the BUSCO run:
cp Pediculus/short_summary.specific.arthropoda_odb10.Pediculus.txt BUSCO_summaries/
python3 /workspace/mambaforge/envs/course/bin/generate_plot.py -wd BUSCO_summaries
Note
This will produce a single plot containing the results of both BUSCO runs, SacJurei and Pediculus. Keep in mind that these runs were performed with different modes (genome vs proteins), hence represent different results!

There are only 8 “missing” BUSCOs from this annotation set. Searching OrthoDB v10 for the first one, 127998at6656, shows it to be Ribosomal protein L7A/L8, an otherwise highly-conserved gene (168 of 172 arthropods).

I thought that this was probably unlikely to be a real missing gene, so I searched the genome using the Drosophila melanogaster orthologue and I found a good hit in the Pediculus genome assembly, in a region where no gene was annotated! I therefore used the available transcriptomics data (blue) to create a manual annotation for this gene (green), so one day when manual annotations make their way into official gene sets at the NCBI this gene will no longer appear as “missing” when performing an assessment of the annotated gene set.

A sequence alignment with orthologues from other species convinces me that I have managed to correctly annotate the complete gene in Pediculus.

A cautionary note about alternative transcripts
- We used the Pediculus annotation from the NCBI
- We did no pre-filtering of this annotation set to select just one protein representative per gene
Question: Why would we normally want to select just one protein representative per gene when running an assessment of an annotation set?
Answer
Keeping all the isoforms of a gene will artificially increase the number of Duplicated BUSCOs and lead to a biased assessment of the annotation set.
We can actually count the number of proteins in the Pediculus protein FASTA file to see if this affects our analysis:
grep -c '>' ncbi_dataset/data/GCF_000006295.1/protein.faa
This tells us there are 10‘775 proteins in this file, but remember that the NCBI page indicated that there were 10‘773 protein-coding genes in this annotation set:
- In this case therefore there is at least one gene, possibly two genes, with alternative transcripts annotated
- So here the impact on our analysis will be negligible if anything
The NCBI are working on providing “reference” annotation sets that contain one selected representative protein per gene. For now though you would have to perform the filtering yourself if you wanted to ensure the “duplication” values produced by BUSCO make sense in terms of reporting real gene duplications rather than alternative protein products of a single gene.