Finding information about function of a group of genes
Aim
Learn to explore the function of a set of genes as a group using GO enrichment, TopAnat and Bgee expression values.
Learning outcomes
- What can a GO enrichment analysis tell us about the function of a set of genes of interest?
- What can TopAnat tell us about it?
- What can we learn on gene expression evolution by clustering expression values?
GO enrichment
The first thing we can do to study the function of these genes as a set is a GO enrichment analysis. It will show us which GO terms are statistically over-represented in the list.
We will do the GO enrichment species per species, for some species, and then we will be able to compare the results. In the file of our list of orthologs we have all the species Ensembl IDs. We will need to select only one species IDs at a time. To do so, download the file and open it in Excel or similar.
Go to the PANTHER knowledgebase website.
Let’s start with human. Paste the complete list of human IDs in the box Enter IDs, select the species, Statistical overrepresentation test and GO biological processes complete as shown in the image below. Submit.

Note
The Statistical overrepresentation test, compares a test gene list to a reference gene list, and determines whether a particular GO term is overrepresented or not in this list. It is the GO enrichment that we have been referring to. The Statistical enrichment test option requires a list of genes with associated numerical values for each gene. It is also an enrichment analysis for another type of data, not the case we are doing here.
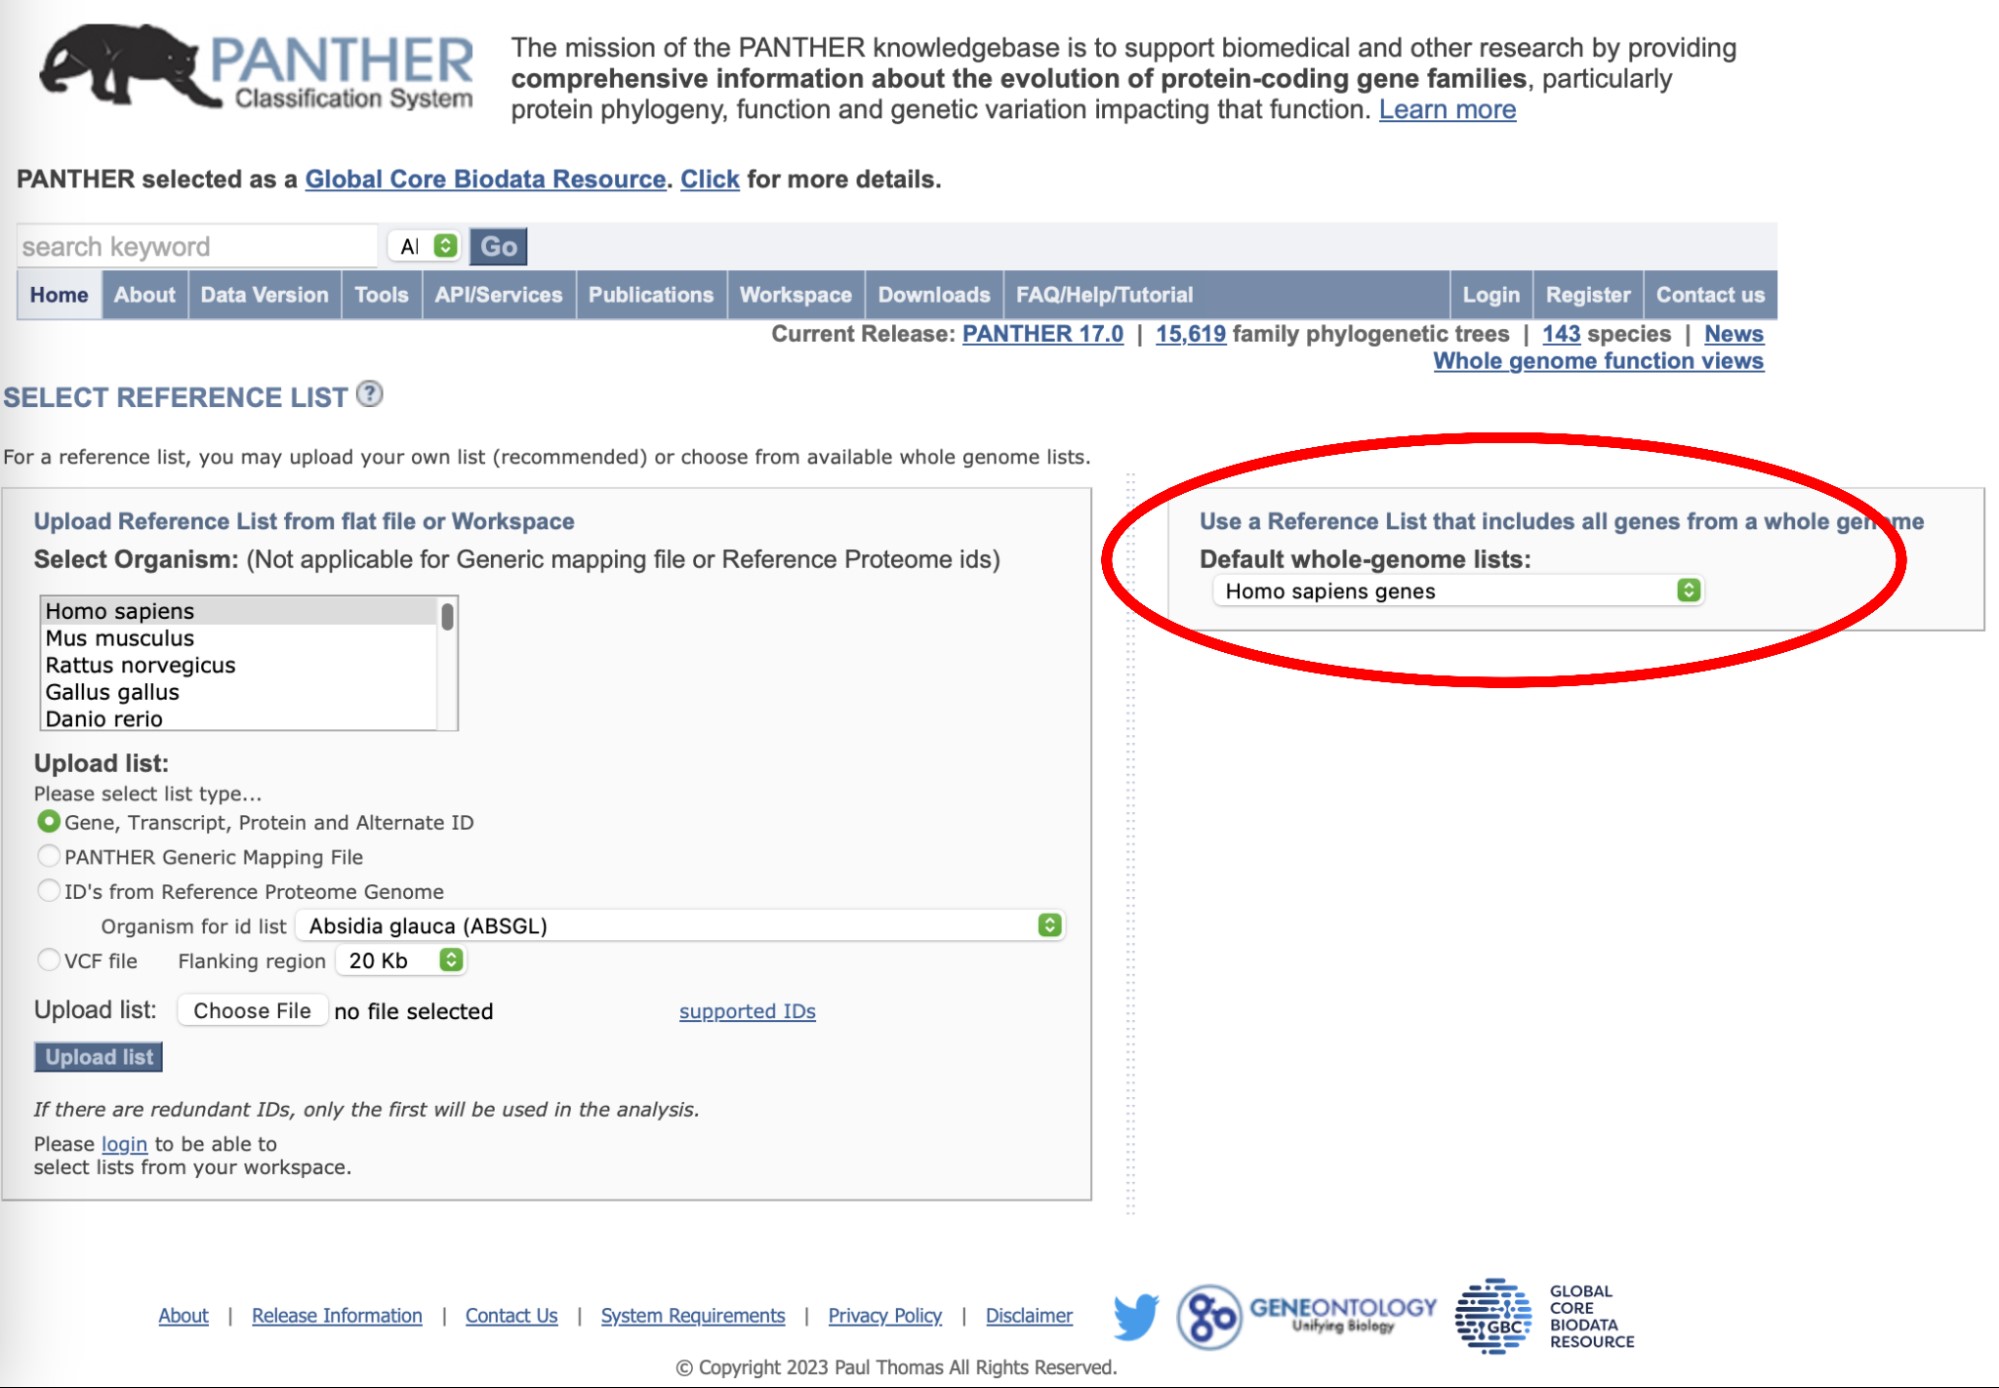
Another page will appear asking which reference set of genes to use as the universe for the overrepresentation test. Select the human whole genome list of genes on the right panel as in the image.
Then, another page will appear with a summary of what you just selected and asking for details on the statistical tests. Make sure the Fisher’s exact test and the False Discovery Rate options are selected and launch the analysis.

Great, we have done the GO enrichment analysis for the human genes in our list. Take a look at the results. The columns that give us the most information are the Fold Enrichment that quantifies how much a given GO term is overrepresented in the gene list, and the Fdr (False Discovery Rate) that will let us know if a given enrichment is statistically significant.
Questions:
- What kind of GO terms do you see enriched?
- Is it what you expected?
Answer
- We see a list of enriched GO terms with a lot of representation of essential biological processes like development and essential molecular functions. There are some GO terms related to transport or response to stimulus too but not a lot
- Yes, it is what we expected because we are using a list of one-to-one orthologs between mammals and chicken. They are expected to be genes related to essential biological functions
Repeat the same analysis for the opossum and the chicken gene lists in new browser tabs. Keep the results of the human gene list open and compare them.
Questions:
- Are the results consistent among species?
- How do annotations differ between species?
Answer
- For the chicken we see much more GO terms related to transport, regulation and immune system than for the human. We also see some biological process specific of birds. The opossum enriched GO term list is much more similar to that of human. We see a lot of developmental and core processes. No opossum-specific biological process can be seen and, in general, the therms are less specific
- The human case is clearly the most detailed. Opossum annotation seems to be mainly retrieved from that of other mammal species, this is why we don’t see a lot of specificity in GO terms and none specific of opossum. Chicken annotation has some bird-specific terms but showed less essential processes for the same group of orthologous genes. This might suggest that the chicken annotation is not based on that of other model species, but it is a bit incomplete and biased towards the most studied processes in this species
Extra questions if time permits
Do a GO enrichment analysis with the list of human genes but this time select the GO molecular function complete list of GO terms. Check the results.

Questions:
- What has changed?
- Are these GO terms more meaningful for understanding the gene function?
Answer
- Few molecular processes are enriched in this list of genes compared to the biological processes GO terms. Nevertheless, the ones that are enriched are related to basic processes like expected. This point towards the one-to-one orthologs being overall enriched in biological processes as a hole more than enriched in more specific molecular functions
- The molecular function GO terms are useful when trying to understand the molecular pathways and metabolic processes enriched in a group of genes. In our case, the biological processes go terms are more meaningful because our list of genes is quite general and related to evolutionary conservation more than to specific molecular characteristics
Tools to visually represent GO enrichment results
TopAnat
To further investigate the function of the list of orthologous genes, we are now going to go back to Bgee website and use the TopAnat tool.
TopAnat is an anatomical entity enrichment analysis tool based on the topGO R package. It is really similar in methodology to the GO enrichment that you just did but instead of using Gene Ontology terms, it is based on Anatomical entities or, in other words, on tissues or organs (more specifically, on Uberon identifiers). This tool will be able to tell us in which anatomical entities the genes in our set are being more expressed compared to a background set of genes.
To access the tool in Bgee’s website, please go to the top Analysis section of the top toolbar and click on TopAnat: Expression enrichment analysis (or just click on the red button Expression enrichment analysis on the homepage). Then, fill the gene list box with the list of human genes in our gene set list. We will not change the background genes for now, so you can directly press the Submit your job button after optionally putting your email address and a name to the job. The results may take a bit to appear.
After a bit, you should get results in the following format at the bottom of the page:

You can filter the result table based on any column by clicking on the column header (try it with Fold Enrichment or with Fdr in order to sort results from more significant to least significant).
Questions
- In which anatomical entities do we have more expression than expected compared to the background genes?
- Why do you think there is a difference if we compare the results sorting by
Fold enrichmentor byFdr?
Answer
- We can see a strong enrichment of our list of genes compared to the whole human genes in gametes, oocytes, spermatocytes
- There can be big differences between the fold enrichment and the Fdr corrected p-value depending on how much data we had available to make the statistical significance tests and therefore the power we had to see any difference.
You can open in another tab the results of the first (1) example case proposed by TopAnat (click on the number 1 next to Examples on the top of the page). you will see the kind of results you would get if you tested a gene list linked to the autism spectrum instead. You can always go back to the results from the last job by clicking on the Recent jobs button and then the name you gave to the job ID.
Question: Do you think genes related to autism are more tissue specific than our list of one-to-one orthologs?
Answer
If we put genes related to autism on TopAnat (example 1 in the website), we can see that the fold enrichments are really high and the Fdr p-values are all extremely low for brain related tissues. Therefore, they seem to indeed be a bit more tissue specific.
Try to do the same steps for other species such as Macaque or Opossum.
Question: Do you get similar results? Do you get more similar results between species than when comparing with autism spectrum results?
Answer
Yes, we do get more similar results than when comparing with autism spectrum genes since the list is composed of genes for which we have orthologs in the different species and orthologs tend to have more similar tissue expression among each other than compared to random autism genes.
Clustering of homologous organ expression in several species
For this step, we are going to do a principal component analysis of the expression values for the multiple conditions and species. We will be using the pca_dataset found in the /data folder of Gitpod. In this dataset, each row represents the TPM value of a set of conditions (such as mouse, liver, male, adult) and each column represents a gene from the previously obtained orthologous gene list for the given species.
To launch the analysis, you need to run the pca_generation.R script found in the /scripts folder using the following command:
Rscript pca_generation.R
Two figures will be generated in the /figure folder, one that colors the points based on species and one based on anatomical entities.
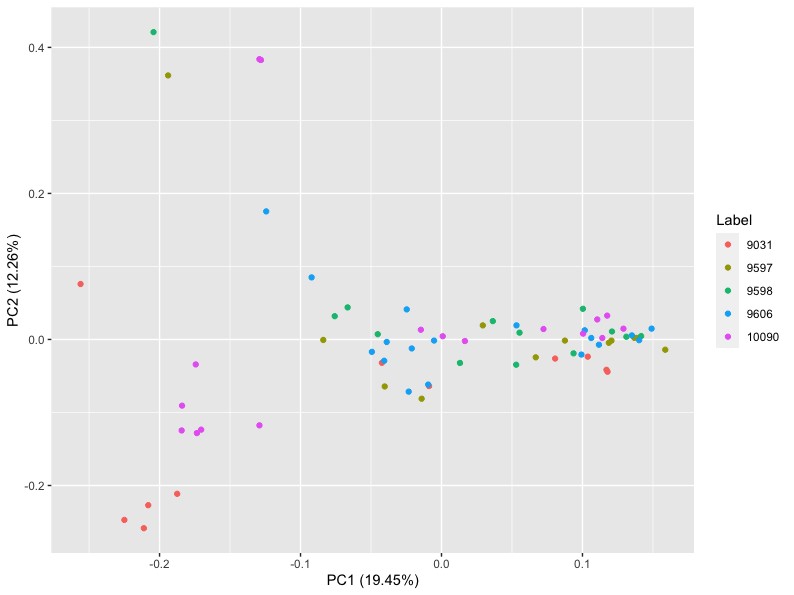
For the first one colored by species, you obtain this graph:
And here is the second one that is colored based on anatomical entities:

Question: According to the PCA figures, is it the organs or the species that cluster more strongly together?
Answer
We can see that the clustering is much better when colored by organs than species, which is a result that is highly expected and seen in numerous studies.