Variant calling
Short variant calling
Now that we have quality-controlled the BAM files, we can go ahead with somatic variant calling.
Somatic variant calling differs from germline calling in several key ways:
- Tumor-normal pairs: We compare tumor against matched normal to identify somatic (tumor-only) variants
- Lower allele frequencies: Somatic variants may be present in only a subset of tumor cells (subclonal)
- Artifacts: Sequencing/alignment artifacts can mimic somatic variants, requiring careful filtering
- Statistical challenge: Distinguishing true low-frequency somatic variants from noise
This is why we need specialized tools like Mutect2 rather than standard germline callers.
For this, we use Mutect2 which is a somatic variant caller from the GATK toolkit. In addition to the expected bam files and references genome, Mutect2 requires some additional input:
--intervals: the intervals of our target regions. This is in theinterval_listformat.-normal: the sample name of the normal sample. So, theSMtag of the read group of the normal sample.--germline-resource: known sites of germline variants with their allele frequencies in the population. These are used to estimate the confidence of a germline variant in the normal sample.--panel-of-normals: A VCF generated from normal samples that contain sites with known technical artifacts. Ideally, you create a PON from your own normal samples, but this is typically recommended if you have more than 40 normal samples. Therefore, here, we use a pre-generated PON from the 1000 genomes project. More information on PON in this article.
Create a script called 03_run_mutect2.sh. After that, check out the manual of Mutect2 and replace the placeholders FIXME with the required values of the Mutect2 below command and run it:
#!/usr/bin/env bash

ALIGNDIR=~/project/data/alignments
REFDIR=~/project/data/reference
RESOURCEDIR=~/project/data/resources
VARIANTDIR=~/project/variants

mkdir -p "$VARIANTDIR"

gatk Mutect2 \
-R FIXME \
--intervals "$REFDIR"/exome_regions.bed.interval_list \
-I FIXME \
-I FIXME \
-normal FIXME \
--germline-resource "$RESOURCEDIR"/af-only-gnomad.hg38.subset.vcf.gz \
--panel-of-normals "$RESOURCEDIR"/1000g_pon.hg38.subset.vcf.gz \
-O "$VARIANTDIR"/somatic.vcf.gzThis takes a while to run. Have a break!
#!/usr/bin/env bash

ALIGNDIR=~/project/data/alignments
REFDIR=~/project/data/reference
RESOURCEDIR=~/project/data/resources
VARIANTDIR=~/project/variants

mkdir -p $VARIANTDIR

gatk Mutect2 \
-R "$REFDIR"/ref_genome.fa \
--intervals "$REFDIR"/exome_regions.bed.interval_list \
-I "$ALIGNDIR"/tumor.recal.bam \
-I "$ALIGNDIR"/normal.recal.bam \
-normal normal \
--germline-resource "$RESOURCEDIR"/af-only-gnomad.hg38.subset.vcf.gz \
--panel-of-normals "$RESOURCEDIR"/1000g_pon.hg38.subset.vcf.gz \
-O "$VARIANTDIR"/somatic.vcf.gz
Notes
-normal: comes from the read group in the bam files (SMtag)--germline-resource: A VCF of known germline variants from large population studies (gnomAD, 1000 Genomes)--panel-of-normals: These are NOT real biological variants - they’re sequencing/alignment errors (ideally from >40-100 normal samples from the same cohort)
After calling the variants we can do an initial filtering step. We do this with FilterMutectCalls. This method takes technical artifacts, possibility of germline variants, and sequencing error in account, calculates an error probability and tries to optimize between recall and precision.
Create a script called 04_filter_mutect_calls.sh in ~/project/scripts. From the script, run the command to filter the somatic variants:
#!/usr/bin/env bash

REFDIR=~/project/data/reference
VARIANTDIR=~/project/variants

# fill the filter column
gatk FilterMutectCalls \
-R "$REFDIR"/ref_genome.fa \
-V "$VARIANTDIR"/somatic.vcf.gz \
-O "$VARIANTDIR"/somatic.filtered.vcf.gz

# create a vcf with variants passing filters (PASS)
bcftools view -f PASS "$VARIANTDIR"/somatic.filtered.vcf.gz -Oz \
> "$VARIANTDIR"/somatic.filtered.PASS.vcf.gz

bcftools index --tbi "$VARIANTDIR"/somatic.filtered.PASS.vcf.gz
How many variants were kept? What were the main reason for filtering them out?
The filtering information is in the 7th column of the vcf, so you can do something like:
bcftools view -H my_variants.vcf.gz | cut -f 7 | sort | uniq -c | sort -nr | head -n 10To get the number of variants in the unfiltered vcf:
VARIANTDIR=~/project/variants
bcftools view -H "$VARIANTDIR"/somatic.vcf.gz | wc -l
Resulting in 467 unfiltered variants.
To get the 10 most frequently occurring filters in the filter column of the filtered vcf:
VARIANTDIR=~/project/variants
bcftools view -H "$VARIANTDIR"/somatic.filtered.vcf.gz | cut -f 7 | sort | uniq -c | sort -nr | head -n 10
Resulting in:
133 PASS
48 weak_evidence
26 normal_artifact;strand_bias
21 panel_of_normals
17 normal_artifact
13 normal_artifact;slippage;weak_evidence
13 clustered_events;normal_artifact;strand_bias
12 germline;multiallelic;normal_artifact;panel_of_normals
12 base_qual;normal_artifact;strand_bias
9 strand_bias;weak_evidence
So most variants were filtered out, and most of the variants were filtered out because of ‘weak evidence’.
In order to figure out what that means we can check out the vcf header:
VARIANTDIR=~/project/variants
bcftools view -h "$VARIANTDIR"/somatic.filtered.vcf.gz | grep "^##FILTER"
Resulting in:
##FILTER=<ID=FAIL,Description="Fail the site if all alleles fail but for different reasons.">
##FILTER=<ID=PASS,Description="Site contains at least one allele that passes filters">
##FILTER=<ID=base_qual,Description="alt median base quality">
##FILTER=<ID=clustered_events,Description="Clustered events observed in the tumor">
##FILTER=<ID=contamination,Description="contamination">
##FILTER=<ID=duplicate,Description="evidence for alt allele is overrepresented by apparent duplicates">
##FILTER=<ID=fragment,Description="abs(ref - alt) median fragment length">
##FILTER=<ID=germline,Description="Evidence indicates this site is germline, not somatic">
##FILTER=<ID=haplotype,Description="Variant near filtered variant on same haplotype.">
##FILTER=<ID=low_allele_frac,Description="Allele fraction is below specified threshold">
##FILTER=<ID=map_qual,Description="ref - alt median mapping quality">
##FILTER=<ID=multiallelic,Description="Site filtered because too many alt alleles pass tumor LOD">
##FILTER=<ID=n_ratio,Description="Ratio of N to alt exceeds specified ratio">
##FILTER=<ID=normal_artifact,Description="artifact_in_normal">
##FILTER=<ID=orientation,Description="orientation bias detected by the orientation bias mixture model">
##FILTER=<ID=panel_of_normals,Description="Blacklisted site in panel of normals">
##FILTER=<ID=position,Description="median distance of alt variants from end of reads">
##FILTER=<ID=possible_numt,Description="Allele depth is below expected coverage of NuMT in autosome">
##FILTER=<ID=slippage,Description="Site filtered due to contraction of short tandem repeat region">
##FILTER=<ID=strand_bias,Description="Evidence for alt allele comes from one read direction only">
##FILTER=<ID=strict_strand,Description="Evidence for alt allele is not represented in both directions">
##FILTER=<ID=weak_evidence,Description="Mutation does not meet likelihood threshold">
Showing us that these mutations do not meet the likelihood threshold, basically telling us that these are the variants filtered out because of the combined error probability based on technical artifacts, possibility of germline variants, and sequencing error. The other filters are so called ‘hard filters’, meaning that by themselves they do not meet a fixed threshold.
EXTRA: Summarizing the VCF
Do the exercises about summarizing the VCF only if you have time. Otherwise, continue to Copy number variation calling.
Let’s check out the VCF in a bit more detail. We’d like to have an idea what kind of variants are in there, and what for example their variant allele frequency is.
First, we can check what the variants look like:
VARIANTDIR=~/project/variants
bcftools view -H "$VARIANTDIR"/somatic.filtered.vcf.gz | head
Showing us that both the FORMAT and INFO fields are filled with information. To check out the meaning of what is in the INFO field you can run:
VARIANTDIR=~/project/variants
bcftools view -h "$VARIANTDIR"/somatic.filtered.vcf.gz | grep "^##INFO"
And you can do the same for the format fields:
VARIANTDIR=~/project/variants
bcftools view -h "$VARIANTDIR"/somatic.filtered.vcf.gz | grep "^##FORMAT"
To summarize the vcf for information in the format or info fields you can use bcftools query. For example, for getting the likelihood of variant and depth of each sample, you can do the following (for the first 20 variants):
VARIANTDIR=~/project/variants
bcftools query -f '%CHROM\t%POS\t%FILTER\t\t%INFO/TLOD\t[%SAMPLE=%DP;]\n' "$VARIANTDIR"/somatic.filtered.vcf.gz | head -20Instead of the depth DP for each sample get the variant allele frequency for each sample, and compare that with the FILTER column.
We can check which tag contains the variant allele frequency in the vcf:
VARIANTDIR=~/project/variants
bcftools view -h "$VARIANTDIR"/somatic.filtered.vcf.gz | grep "^##FORMAT"
Returning:
##FORMAT=<ID=AD,Number=R,Type=Integer,Description="Allelic depths for the ref and alt alleles in the order listed">
##FORMAT=<ID=AF,Number=A,Type=Float,Description="Allele fractions of alternate alleles in the tumor">
##FORMAT=<ID=DP,Number=1,Type=Integer,Description="Approximate read depth (reads with MQ=255 or with bad mates are filtered)">
##FORMAT=<ID=F1R2,Number=R,Type=Integer,Description="Count of reads in F1R2 pair orientation supporting each allele">
##FORMAT=<ID=F2R1,Number=R,Type=Integer,Description="Count of reads in F2R1 pair orientation supporting each allele">
##FORMAT=<ID=FAD,Number=R,Type=Integer,Description="Count of fragments supporting each allele.">
##FORMAT=<ID=GQ,Number=1,Type=Integer,Description="Genotype Quality">
##FORMAT=<ID=GT,Number=1,Type=String,Description="Genotype">
##FORMAT=<ID=PGT,Number=1,Type=String,Description="Physical phasing haplotype information, describing how the alternate alleles are phased in relation to one another; will always be heterozygous and is not intended to describe called alleles">
##FORMAT=<ID=PID,Number=1,Type=String,Description="Physical phasing ID information, where each unique ID within a given sample (but not across samples) connects records within a phasing group">
##FORMAT=<ID=PL,Number=G,Type=Integer,Description="Normalized, Phred-scaled likelihoods for genotypes as defined in the VCF specification">
##FORMAT=<ID=PS,Number=1,Type=Integer,Description="Phasing set (typically the position of the first variant in the set)">
##FORMAT=<ID=SB,Number=4,Type=Integer,Description="Per-sample component statistics which comprise the Fisher's Exact Test to detect strand bias.">
Where AF contains ‘Allele fractions of alternate alleles in the tumor’, so that is the tag we are looking for. So, we replace DP with AF:
VARIANTDIR=~/project/variants
bcftools query -f '%CHROM\t%POS\t%FILTER\t\t%INFO/TLOD\t[%SAMPLE=%AF;]\n' "$VARIANTDIR"/somatic.filtered.vcf.gz | head -30
Returning:
chr6    106265  map_qual;strand_bias;weak_evidence              3.99    normal=0.00671;tumor=0.01;
chr6    325357  PASS            719.91  normal=0.001054;tumor=0.161;
chr6    325783  PASS            1292.31 normal=0.0009626;tumor=0.224;
chr6    325901  PASS            1030.6  normal=0.005447;tumor=0.183;
chr6    325916  PASS            937.7   normal=0.004142;tumor=0.116;
chr6    1742560 panel_of_normals                235.6   normal=0.02;tumor=0.41;
chr6    1916336 PASS            187.23  normal=0.022;tumor=0.482;
chr6    1930220 PASS            152.54  normal=0.016;tumor=0.207;
chr6    2674999 PASS            190.32  normal=0.028;tumor=0.514;
chr6    2834013 PASS            245.04  normal=0.02;tumor=0.494;
chr6    2840548 PASS            274.4   normal=0.021;tumor=0.522;
chr6    3110986 weak_evidence           3.03    normal=0.017;tumor=0.019;
chr6    3723708 PASS            266.67  normal=0.017;tumor=0.42;
chr6    4892169 weak_evidence           4.43    normal=0.024;tumor=0.02;
chr6    5103987 germline;multiallelic;normal_artifact;panel_of_normals          13.57,257.27    normal=0.037,0.825;tumor=0.077,0.834;
chr6    6250887 PASS            260.99  normal=0.018;tumor=0.459;
chr6    7176847 PASS            107.39  normal=0.026;tumor=0.319;
chr6    7585458 PASS            171.88  normal=0.015;tumor=0.283;
chr6    7833697 PASS            122.24  normal=0.057;tumor=0.513;
chr6    7883281 germline                99.5    normal=0.05;tumor=0.476;
chr6    8054329 PASS            420.89  normal=0.045;tumor=0.446;
chr6    9900366 panel_of_normals                525.07  normal=0.024;tumor=0.992;
chr6    10397660        germline;multiallelic;slippage          3.21,50.94      normal=0.042,0.043;tumor=0.098,0.798;
chr6    10398435        PASS            365.76  normal=0.013;tumor=0.943;
chr6    10801908        PASS            91.41   normal=0.02;tumor=0.312;
chr6    10989772        PASS            71.25   normal=0.041;tumor=0.49;
chr6    11306007        PASS            209.24  normal=0.009359;tumor=0.4;
chr6    13479062        germline;multiallelic;normal_artifact;panel_of_normals          4.63,5.86,13.96 normal=0.022,0.027,0.258;tumor=0.043,0.068,0.165;
chr6    13977507        weak_evidence           3.4     normal=0.012;tumor=0.027;
chr6    16147945        PASS            331.72  normal=0.014;tumor=0.978;
Where we see that if there’s the filter weak_evidence the VAF of the tumor is typically low.
Key observations:
- PASS variants typically have:
- Tumor VAF >0.15 (15%)
- Low/zero VAF in normal (<0.03)
- Example: chr6:325357 has tumor=0.161, normal=0.001
- weak_evidence variants show:
- Very low tumor VAF (<0.05)
- Near the detection limit
- Example: chr6:106265 has tumor=0.01, normal=0.00671
- germline tagged variants:
- Similar VAF in both tumor and normal
- Example: chr6:5103987 has normal=0.825, tumor=0.834 (very similar)
- These are inherited variants, not somatic
- panel_of_normals filtered variants:
- May have high VAF but appear in technical artifact database
- Example: chr6:9900366 has very high tumor VAF (0.992) but filtered
Copy number variation calling
Variation of copy number in genes can have a large effect on the phenotype of a tumor. Therefore, we will also estimate the copy number variation occurring on chromosome 6 and 17. For that, we use CNVkit.
Check out the documentation of CNVkit.py bash, and the helper (cnvkit.py batch -h), create a script called 05_run_cnvkit.sh, and replace the missing values at FIXME.
After that, checkout the visualizations (tumor-scatter.png) at ~/project/variants/cnvkit. Do you see any evidence for copy number variation?
#!/usr/bin/env bash

ALIGNDIR=~/project/data/alignments
REFDIR=~/project/data/reference
RESOURCEDIR=~/project/data/resources
VARIANTDIR=~/project/variants

cnvkit.py batch FIXME \
--normal FIXME \
--targets FIXME \
--fasta FIXME \
--annotate "$RESOURCEDIR"/refFlat.txt \
--output-reference "$VARIANTDIR"/reference.cnn \
--output-dir "$VARIANTDIR"/cnvkit/ \
--processes 4 \
--scatter \
--diagramWe provide the tumor bam, normal bam, the interval list (can also be a bed file) and our reference genome:
#!/usr/bin/env bash
ALIGNDIR=~/project/data/alignments
REFDIR=~/project/data/reference
RESOURCEDIR=~/project/data/resources
VARIANTDIR=~/project/variants
cnvkit.py batch "$ALIGNDIR"/tumor.recal.bam \
--normal "$ALIGNDIR"/normal.recal.bam \
--targets "$REFDIR"/exome_regions.bed.interval_list \
--fasta "$REFDIR"/ref_genome.fa \
--annotate "$RESOURCEDIR"/refFlat.txt \
--output-reference "$VARIANTDIR"/reference.cnn \
--output-dir "$VARIANTDIR"/cnvkit/ \
--processes 4 \
--scatter \
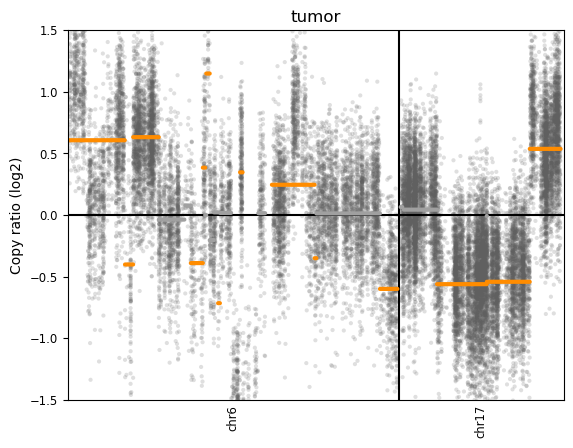
--diagramAfter running cnvkit, multiple files are created in ~/project/variants/cnvkit. The scatter plot is typically interesting to investigate at first:
Interpretation:
CNVkit reports log2 ratios relative to a diploid (2 copy) baseline:
- Formula: Copy number = 2^(log2_ratio) × 2
- Examples:
- log2 ratio = 0 → 2^(0) × 2 = 2 copies (normal diploid)
- log2 ratio = +0.58 → 2^(0.58) × 2 ≈ 3 copies (gain)
- log2 ratio = -1.0 → 2^(-1.0) × 2 = 1 copy (loss)
Here we see evidence for both losses and gains on both chromosomes:
Chromosome 6:
- Multiple segments with varying copy number
- Regions around log2 ratio +0.6 (gain - approximately 3 copies)
- Regions around log2 ratio -0.5 (loss - approximately 1 copy)
- Some neutral regions around 0 (diploid)
Chromosome 17:
- Large deletion in the p-arm (short arm, left side): log2 ratio ≈ -0.6 to -0.7
- This represents loss of one copy across a large chromosomal region
- Gain in the q-arm (long arm, right side): log2 ratio ≈ +0.6
- This represents an extra copy (3 copies total)
Key observations:
- Log2 ratio of +0.6 ≈ 3 copies (one extra copy: log2(3/2) = 0.58)
- Log2 ratio of -0.6 to -0.7 ≈ 1.2-1.3 copies (partial loss of one allele)
- Log2 ratio of -1.0 = 1 copy (complete loss of one allele: log2(1/2) = -1.0)
- Log2 ratio of +1.0 ≈ 4 copies (duplication: log2(4/2) = 1.0)
The orange lines represent segmented regions with similar copy number (segments), while the gray dots show individual bin-level measurements from targeted regions.
Note: These HCC1395 cells are from a TNBC cell line, so we’d expect to see typical TNBC alterations including TP53 loss.
The pattern observed on chromosome 17 is particularly interesting for breast cancer:
- Chr17p deletion (the large loss we see) often involves TP53 (17p13.1), a critical tumor suppressor
- TP53 loss is extremely common in TNBC (>80% of cases)
- Loss of p53 function removes a key cell cycle checkpoint
- Chr17q gain (the amplification we see) may include genes like ERBB2/HER2 (17q12)
- Although TNBC is typically HER2-negative by definition, focal amplifications can occur
- Other oncogenes on 17q may also be amplified
This type of arm-level copy number change (one arm deleted, other amplified) is characteristic of chromosomal instability common in cancer.
CNVkit is described in detail in:
Talevich et al. (2016). CNVkit: Genome-Wide Copy Number Detection and Visualization from Targeted DNA Sequencing. PLOS Computational Biology.
Summary
In this section, you’ve:
- ✅ Called somatic variants with Mutect2 using tumor-normal pairs
- ✅ Filtered variants based on multiple quality metrics
- ✅ Explored VCF format and variant characteristics
- ✅ Identified copy number variations with CNVkit
You now have:
somatic.filtered.PASS.vcf.gz: High-confidence somatic SNVs- CNVkit outputs: Copy number segmentation and visualizations
Next steps: We’ll annotate these variants to understand their functional impact and clinical significance.