library(ComplexHeatmap)
library(EnrichedHeatmap)
library(SummarizedExperiment)
library(gUtils)
library(rtracklayer)
library(data.table)
library(parallel)
library(R.utils)
library(circlize)
library(dplyr)
library(tibble)Exercise 4
Overlapping all the datasets
Learning Objectives
By the end of this exercise, you will be able to: - Load and explore genomic data using Bioconductor classes such as GRangesList and RangedSummarizedExperiment. - Subset and filter genomic features based on annotation or genomic coordinates. - Perform basic overlap and distance-based queries between genomic intervals. - Integrate multi-assay data (e.g., chromatin marks and gene expression) using shared genomic coordinates.
Load Libraries
SE objects
Overlap matrix
To make the overlapMatrix (you could also say overlapRanges), we need to identify a target.
Function to merge Genomic Ranges
# Merge metadata from two GRanges objects based on overlaps
metaGR <- function(gr1, gr2, minOverlap = 1) {
  # Initialize metadata with gr1's metadata
  mcols_out <- mcols(gr1)

  # Find overlaps (keep all from gr1)
  hits <- findOverlaps(gr1, gr2, minoverlap = minOverlap)
  idx1 <- subjectHits(hits)
  idx2 <- queryHits(hits)

  # Prepare new metadata to be added
  new_mcols <- DataFrame(matrix(NA, nrow = length(gr1), ncol = ncol(mcols(gr2))))
  colnames(new_mcols) <- colnames(mcols(gr2))

  # Fill metadata only for overlaps
  new_mcols[idx2, ] <- mcols(gr2)[idx1, , drop = FALSE]

  # Combine original and new metadata
  mcols(gr1) <- cbind(mcols_out, new_mcols)

  return(gr1)
}
ATAC-Seq
RNA
ChIP-Seq
H3K4me3
H3K4me1
rd_h3k4me1 <- rowRanges(h3k4me1)
rd_h3k4me1 <- rd_h3k4me1[abs(rd_h3k4me1$logFC) >= 0.5 & rd_h3k4me1$qvalue <= 0.1]
colnames(elementMetadata(rd_h3k4me1)) <- paste("H3K4me1", colnames(elementMetadata(rd_h3k4me1)), sep = "_")
overlap <- metaGR(gr1 = overlap, gr2 = rd_h3k4me1, minOverlap = 10)
Warning in .merge_two_Seqinfo_objects(x, y): Each of the 2 combined objects has sequence levels not in the other:
- in 'x': chrY
- in 'y': chr4_GL456216_random, chr4_JH584295_random, chrX_GL456233_random, chrUn_JH584304
Make sure to always combine/compare objects based on the same reference
genome (use suppressWarnings() to suppress this warning).H3K27me3
rd_h3k27me3 <- rowRanges(h3k27me3)
rd_h3k27me3 <- rd_h3k27me3[abs(rd_h3k27me3$logFC) >= 0.5 & rd_h3k27me3$qvalue <= 0.1]
colnames(elementMetadata(rd_h3k27me3)) <- paste("H3K27me3", colnames(elementMetadata(rd_h3k27me3)), sep = "_")
overlap <- metaGR(gr1 = overlap, gr2 = rd_h3k27me3, minOverlap = 10)
H3K27ac
Save data
# Add a name field and save the final integrated object
overlap$name <- paste("peak", 1:length(overlap), sep = "_")
names(overlap) <- overlap$name

dir.create("output")
Warning in dir.create("output"): 'output' already existssaveRDS(object = overlap, file = "output/overlap_data.rds")Snapshot of overlaMatrix
overlap[1:3]GRanges object with 3 ranges and 109 metadata columns:
seqnames ranges strand | ATAC_annotation ATAC_geneChr
<Rle> <IRanges> <Rle> | <character> <integer>
peak_1 chr1 3670547-3672665 * | Promoter (<=1kb) 1
peak_2 chr1 4332510-4332710 * | Intron (ENSMUST00000.. 1
peak_3 chr1 4491755-4492573 * | Promoter (1-2kb) 1
ATAC_geneStart ATAC_geneEnd ATAC_geneLength ATAC_geneStrand
<integer> <integer> <integer> <integer>
peak_1 3214482 3671498 457017 2
peak_2 4344146 4360314 16169 2
peak_3 4492465 4493735 1271 2
ATAC_geneId ATAC_transcriptId ATAC_distanceToTSS ATAC_ENSEMBL
<character> <character> <numeric> <character>
peak_1 497097 ENSMUST00000070533.4 0 ENSMUSG00000051951
peak_2 19888 ENSMUST00000027032.5 27604 ENSMUSG00000025900
peak_3 20671 ENSMUST00000191939.1 1162 ENSMUSG00000025902
ATAC_SYMBOL ATAC_GENENAME ATAC_anno ATAC_logFC ATAC_logCPM
<character> <character> <character> <numeric> <numeric>
peak_1 Xkr4 X-linked Kx blood gr.. Promoter 0.602984 10.45378
peak_2 Rp1 retinitis pigmentosa.. Intron 0.855748 5.18424
peak_3 Sox17 SRY (sex determining.. Promoter -0.620926 7.13469
ATAC_F ATAC_PValue ATAC_qvalue RNA_Row.names RNA_gene_id
<numeric> <numeric> <numeric> <character> <character>
peak_1 41.78446 6.58453e-08 4.81983e-07 ENSMUSG00000051951 497097
peak_2 3.68371 6.13517e-02 9.28785e-02 <NA> <NA>
peak_3 9.14522 4.12368e-03 8.38540e-03 <NA> <NA>
RNA_SYMBOL RNA_GENENAME RNA_ENSEMBL RNA_geneLength
<character> <character> <character> <integer>
peak_1 Xkr4 X-linked Kx blood gr.. ENSMUSG00000051951 457017
peak_2 <NA> <NA> <NA> <NA>
peak_3 <NA> <NA> <NA> <NA>
RNA_geneChr RNA_geneStart RNA_geneEnd RNA_geneStrand RNA_geneId
<character> <integer> <integer> <character> <character>
peak_1 chr1 3214482 3671498 - 497097
peak_2 <NA> <NA> <NA> <NA> <NA>
peak_3 <NA> <NA> <NA> <NA> <NA>
RNA_transcriptId RNA_anno RNA_logFC RNA_logCPM RNA_F
<character> <character> <numeric> <numeric> <numeric>
peak_1 ENSMUST00000070533.4 Gene 1.37498 5.62452 33.7077
peak_2 <NA> <NA> NA NA NA
peak_3 <NA> <NA> NA NA NA
RNA_PValue RNA_qvalue H3K4me3_annotation H3K4me3_geneChr
<numeric> <numeric> <character> <integer>
peak_1 0.00224273 0.00628871 Promoter (<=1kb) 1
peak_2 NA NA <NA> <NA>
peak_3 NA NA <NA> <NA>
H3K4me3_geneStart H3K4me3_geneEnd H3K4me3_geneLength
<integer> <integer> <integer>
peak_1 3214482 3671498 457017
peak_2 <NA> <NA> <NA>
peak_3 <NA> <NA> <NA>
H3K4me3_geneStrand H3K4me3_geneId H3K4me3_transcriptId
<integer> <character> <character>
peak_1 2 497097 ENSMUST00000070533.4
peak_2 <NA> <NA> <NA>
peak_3 <NA> <NA> <NA>
H3K4me3_distanceToTSS H3K4me3_ENSEMBL H3K4me3_SYMBOL
<numeric> <character> <character>
peak_1 0 ENSMUSG00000051951 Xkr4
peak_2 NA <NA> <NA>
peak_3 NA <NA> <NA>
H3K4me3_GENENAME H3K4me3_anno H3K4me3_logFC H3K4me3_logCPM
<character> <character> <numeric> <numeric>
peak_1 X-linked Kx blood gr.. Promoter 0.607114 9.26749
peak_2 <NA> <NA> NA NA
peak_3 <NA> <NA> NA NA
H3K4me3_F H3K4me3_PValue H3K4me3_qvalue H3K4me1_annotation
<numeric> <numeric> <numeric> <character>
peak_1 135.443 4.65079e-31 1.28968e-29 <NA>
peak_2 NA NA NA <NA>
peak_3 NA NA NA <NA>
H3K4me1_geneChr H3K4me1_geneStart H3K4me1_geneEnd H3K4me1_geneLength
<integer> <integer> <integer> <integer>
peak_1 <NA> <NA> <NA> <NA>
peak_2 <NA> <NA> <NA> <NA>
peak_3 <NA> <NA> <NA> <NA>
H3K4me1_geneStrand H3K4me1_geneId H3K4me1_transcriptId
<integer> <character> <character>
peak_1 <NA> <NA> <NA>
peak_2 <NA> <NA> <NA>
peak_3 <NA> <NA> <NA>
H3K4me1_distanceToTSS H3K4me1_ENSEMBL H3K4me1_SYMBOL H3K4me1_GENENAME
<numeric> <character> <character> <character>
peak_1 NA <NA> <NA> <NA>
peak_2 NA <NA> <NA> <NA>
peak_3 NA <NA> <NA> <NA>
H3K4me1_anno H3K4me1_logFC H3K4me1_logCPM H3K4me1_F H3K4me1_PValue
<character> <numeric> <numeric> <numeric> <numeric>
peak_1 <NA> NA NA NA NA
peak_2 <NA> NA NA NA NA
peak_3 <NA> NA NA NA NA
H3K4me1_qvalue H3K27me3_annotation H3K27me3_geneChr H3K27me3_geneStart
<numeric> <character> <integer> <integer>
peak_1 NA <NA> <NA> <NA>
peak_2 NA <NA> <NA> <NA>
peak_3 NA Promoter (<=1kb) 1 4492465
H3K27me3_geneEnd H3K27me3_geneLength H3K27me3_geneStrand
<integer> <integer> <integer>
peak_1 <NA> <NA> <NA>
peak_2 <NA> <NA> <NA>
peak_3 4493735 1271 2
H3K27me3_geneId H3K27me3_transcriptId H3K27me3_distanceToTSS
<character> <character> <numeric>
peak_1 <NA> <NA> NA
peak_2 <NA> <NA> NA
peak_3 20671 ENSMUST00000191939.1 0
H3K27me3_ENSEMBL H3K27me3_SYMBOL H3K27me3_GENENAME
<character> <character> <character>
peak_1 <NA> <NA> <NA>
peak_2 <NA> <NA> <NA>
peak_3 ENSMUSG00000025902 Sox17 SRY (sex determining..
H3K27me3_anno H3K27me3_logFC H3K27me3_logCPM H3K27me3_F
<character> <numeric> <numeric> <numeric>
peak_1 <NA> NA NA NA
peak_2 <NA> NA NA NA
peak_3 Promoter -1.0597 9.04668 87.0802
H3K27me3_PValue H3K27me3_qvalue H3K27ac_annotation H3K27ac_geneChr
<numeric> <numeric> <character> <integer>
peak_1 NA NA Promoter (<=1kb) 1
peak_2 NA NA <NA> <NA>
peak_3 1.32026e-20 5.28858e-18 <NA> <NA>
H3K27ac_geneStart H3K27ac_geneEnd H3K27ac_geneLength
<integer> <integer> <integer>
peak_1 3214482 3671498 457017
peak_2 <NA> <NA> <NA>
peak_3 <NA> <NA> <NA>
H3K27ac_geneStrand H3K27ac_geneId H3K27ac_transcriptId
<integer> <character> <character>
peak_1 2 497097 ENSMUST00000070533.4
peak_2 <NA> <NA> <NA>
peak_3 <NA> <NA> <NA>
H3K27ac_distanceToTSS H3K27ac_ENSEMBL H3K27ac_SYMBOL
<numeric> <character> <character>
peak_1 0 ENSMUSG00000051951 Xkr4
peak_2 NA <NA> <NA>
peak_3 NA <NA> <NA>
H3K27ac_GENENAME H3K27ac_anno H3K27ac_logFC H3K27ac_logCPM
<character> <character> <numeric> <numeric>
peak_1 X-linked Kx blood gr.. Promoter 1.25269 8.81735
peak_2 <NA> <NA> NA NA
peak_3 <NA> <NA> NA NA
H3K27ac_F H3K27ac_PValue H3K27ac_qvalue name
<numeric> <numeric> <numeric> <character>
peak_1 151.496 1.67395e-34 4.0813e-32 peak_1
peak_2 NA NA NA peak_2
peak_3 NA NA NA peak_3
-------
seqinfo: 21 sequences from an unspecified genome; no seqlengthsNormalized metrics for plotting
Recommendations based on ENCODE Project Consortium and other literature:
| Assays | Typical Window Size (± kb) | Reason / Notes |
|---|---|---|
| ATAC-seq | ±1 kb | Narrow peaks, accessibility centered on summit |
| H3K4me3 | ±1 kb to ±2 kb | Promoter mark, sharp and narrow peaks |
| H3K4me1 | ±2 kb to ±5 kb | Enhancer-associated, moderately broad |
| H3K27me3 | ±5 kb to ±10 kb | Broad repressive domains |
| H3K27ac | ±2 kb to ±5 kb | Active enhancers/promoters, broader peaks |
We can check the mean and median of each histone marks and make the normalizedMatrix accordingly.
# Calculate mean and median widths for each dataset

summary_table <- tibble(
  Assay = c("ATAC-seq", "H3K4me3", "H3K4me1", "H3K27me3", "H3K27ac"),
  Mean_Width = c(
    mean(width(rd_atac)),
    mean(width(rd_h3k4me3)),
    mean(width(rd_h3k4me1)),
    mean(width(rd_h3k27me3)),
    mean(width(rd_h3k27ac))
  ),
  Median_Width = c(
    median(width(rd_atac)),
    median(width(rd_h3k4me3)),
    median(width(rd_h3k4me1)),
    median(width(rd_h3k27me3)),
    median(width(rd_h3k27ac))
  ),
  Min_Width = c(
    min(width(rd_atac)),
    min(width(rd_h3k4me3)),
    min(width(rd_h3k4me1)),
    min(width(rd_h3k27me3)),
    min(width(rd_h3k27ac))
  ),
  Max_Width = c(
    max(width(rd_atac)),
    max(width(rd_h3k4me3)),
    max(width(rd_h3k4me1)),
    max(width(rd_h3k27me3)),
    max(width(rd_h3k27ac))
  )
)

print(summary_table)
# A tibble: 5 × 5
Assay Mean_Width Median_Width Min_Width Max_Width
<chr> <dbl> <dbl> <int> <int>
1 ATAC-seq 956. 932 151 3490
2 H3K4me3 1316. 749 191 18723
3 H3K4me1 791. 563 171 12590
4 H3K27me3 1170. 568 176 23571
5 H3K27ac 914. 618 171 22276As we restricted the data for this course to just 2 chromosomes, maximum peaks are around 1kb wide. Hence, we will go ahead with +/- 1kb windows for our analysis.
Taking 1000 bp around the mid of ATAC-peaks
# Extract midpoints of peaks to create windows for visualization
mid_peaks <- gr.mid(overlap)
ATAC
# Load ATAC bigWig files
atac_files <- list.files("data", pattern = "ATAC", full.names = TRUE)
names(atac_files) <- gsub(pattern = "\\.bw", replacement = "", x = basename(atac_files))
atac_bw <- lapply(atac_files, function(x){
  a <- rtracklayer::import(x)
  a <- a[seqnames(a) %in% c("chr1", "chr2")]
  a
})

# Normalize signal around mid_peaks
mat_AS <- lapply(atac_bw, FUN = function(x) {
  normalizeToMatrix(x, mid_peaks,
    extend = 1000,
    value_column = "score",
    include_target = TRUE,
    mean_mode = "w0",
    w = 20,
    smooth = T,
    background = 0
  )
})
Warning: Width of `target` are all 1, `include_target` is set to `FALSE`.
Warning: Width of `target` are all 1, `include_target` is set to `FALSE`.saveRDS(mat_AS, file = "output/mat_atac.rds")ChIP
H3K4me3
h3k4me3_files <- list.files("data", pattern = "H3K4me3", full.names = TRUE)
names(h3k4me3_files) <- gsub(pattern = "\\.bw", replacement = "", x = basename(h3k4me3_files))
h3k4me3_bw <- lapply(h3k4me3_files, function(x){
  a <- rtracklayer::import(x)
  a <- a[seqnames(a) %in% c("chr1", "chr2")]
  a
})

mat_h3k4me3 <- lapply(h3k4me3_bw, FUN = function(x) {
  normalizeToMatrix(x, mid_peaks,
    extend = 1000,
    value_column = "score",
    include_target = TRUE,
    mean_mode = "w0",
    w = 20,
    smooth = T,
    background = 0
  )
})
Warning: Width of `target` are all 1, `include_target` is set to `FALSE`.
Warning: Width of `target` are all 1, `include_target` is set to `FALSE`.saveRDS(mat_h3k4me3, file = "output/mat_h3k4me3.rds")H3K4me1
h3k4me1_files <- list.files("data", pattern = "H3K4me1", full.names = TRUE)
names(h3k4me1_files) <- gsub(pattern = "\\.bw", replacement = "", x = basename(h3k4me1_files))
h3k4me1_bw <- lapply(h3k4me1_files, function(x){
  a <- rtracklayer::import(x)
  a <- a[seqnames(a) %in% c("chr1", "chr2")]
  a
})

mat_h3k4me1 <- lapply(h3k4me1_bw, FUN = function(x) {
  normalizeToMatrix(x, mid_peaks,
    extend = 1000,
    value_column = "score",
    include_target = TRUE,
    mean_mode = "w0",
    w = 20,
    smooth = T,
    background = 0
  )
})
Warning: Width of `target` are all 1, `include_target` is set to `FALSE`.
Warning: Width of `target` are all 1, `include_target` is set to `FALSE`.saveRDS(mat_h3k4me1, file = "output/mat_h3k4me1.rds")H27K4me3
h3k27me3_files <- list.files("data", pattern = "H3K27me3", full.names = TRUE)
names(h3k27me3_files) <- gsub(pattern = "\\.bw", replacement = "", x = basename(h3k27me3_files))
h3k27me3_bw <- lapply(h3k27me3_files, function(x){
  a <- rtracklayer::import(x)
  a <- a[seqnames(a) %in% c("chr1", "chr2")]
  a
})

mat_h3k27me3 <- lapply(h3k27me3_bw, FUN = function(x) {
  normalizeToMatrix(x, mid_peaks,
    extend = 1000,
    value_column = "score",
    include_target = TRUE,
    mean_mode = "w0",
    w = 20,
    smooth = T,
    background = 0
  )
})
Warning: Width of `target` are all 1, `include_target` is set to `FALSE`.
Warning: Width of `target` are all 1, `include_target` is set to `FALSE`.saveRDS(mat_h3k27me3, file = "output/mat_h3k27me3.rds")H27K4ac
h3k27ac_files <- list.files("data", pattern = "H3K27ac", full.names = TRUE)
names(h3k27ac_files) <- gsub(pattern = "\\.bw", replacement = "", x = basename(h3k27ac_files))
h3k27ac_bw <- lapply(h3k27ac_files, function(x){
  a <- rtracklayer::import(x)
  a <- a[seqnames(a) %in% c("chr1", "chr2")]
  a
})

mat_h3k27ac <- lapply(h3k27ac_bw, FUN = function(x) {
  normalizeToMatrix(x, mid_peaks,
    extend = 1000,
    value_column = "score",
    include_target = TRUE,
    mean_mode = "w0",
    w = 20,
    smooth = T,
    background = 0
  )
})
Warning: Width of `target` are all 1, `include_target` is set to `FALSE`.
Warning: Width of `target` are all 1, `include_target` is set to `FALSE`.saveRDS(mat_h3k27ac, file = "output/mat_h3k27ac.rds")RNA
# Match overlapping peak names with RNA-seq gene names
tmp <- elementMetadata(overlap)[,c("RNA_Row.names", "name")]

# Get logCPM matrix
counts <- assay(rna, "logCPM")
counts <- assay(rna, "logCPM") - rowMeans(
  assay(rna, "logCPM")[, grep(pattern = "11half", x = colnames(assay(rna, "logCPM")),
                              value = T)]
)

# Merge gene expression values with peaks
mat_RNA <- merge(tmp, counts, by.x = "RNA_Row.names", by.y = "row.names", all.x = T)

# Set rownames to peak names and cleanup
rownames(mat_RNA) <- mat_RNA$name
mat_RNA <- mat_RNA[,-c(1:2)]
colnames(mat_RNA) <- gsub(pattern = ".tsv.gz", replacement = "", x = colnames(mat_RNA))
mat_RNA <- data.matrix(mat_RNA)
mat_RNA <- mat_RNA[names(overlap),]

# Save data
saveRDS(mat_RNA, file = "output/mat_rna.rds")
WGBS
# Bisulfite seq coverage files after methylation call
bs_files <- list.files("data", pattern = "WGBS", full.names = TRUE)
names(bs_files) <- gsub(pattern = "\\.bed.gz", replacement = "", x = basename(bs_files))

# Reading coverage
bs_cov <- lapply(bs_files, function(x) {
  GRanges(
  fread(
      input = x,
      sep = " ", quote = F, stringsAsFactors = F,
      data.table = FALSE, nThread = parallel::detectCores(), showProgress = F,
      col.names = c("seqnames", "start", "end", "cov", "Me", "Un", "meth")
    )
  )
})

# Normalized matrics
mat_bs <- lapply(bs_cov, FUN = function(x) {
    normalizeToMatrix(x, mid_peaks,
      extend = 1000,
      value_column = "meth",
      include_target = TRUE,
      smooth = TRUE,
      mean_mode = "absolute",
      background = NA
    )
})
Warning: Width of `target` are all 1, `include_target` is set to `FALSE`.Warning: Smoothing is failed for one row because there are very few signals
overlapped to it. Please use `failed_rows(mat)` to get the index of the
failed row and consider to remove it.Warning: Width of `target` are all 1, `include_target` is set to `FALSE`.All signal values are within [0, 1], so we assume it is methylation
signal. Automatically set limit [0, 1] to the smoothed values. If this
is not the case, set argument `limit = NA` in the function to remove
the limits. Set `verbose = FALSE` to turn off this message.Warning: Smoothing is failed for one row because there are very few signals
overlapped to it. Please use `failed_rows(mat)` to get the index of the
failed row and consider to remove it.saveRDS(mat_bs, file = "output/mat_bs.rds")Question 1
Make an EnrichedHeatmap of methylation data.
Tip
EnrichedHeatmap(
  mat = mat_bs$WGBS_11half,    # normalized matrix
  name = "E11.5",              # Name for the plot
  width = unit(4, "cm"),       # Width of the heatmap
  height = unit(8, "cm")      # Height of the heatmap
) + EnrichedHeatmap(
  mat = mat_bs$WGBS_15half,    # normalized matrix
  name = "E15.5",              # Name for the plot
  width = unit(4, "cm"),       # Width of the heatmap
  height = unit(8, "cm")      # Height of the heatmap
)
The automatically generated colors map from the 1^st and 99^th of the
values in the matrix. There are outliers in the matrix whose patterns
might be hidden by this color mapping. You can manually set the color
to `col` argument.
Use `suppressMessages()` to turn off this message.
The automatically generated colors map from the 1^st and 99^th of the
values in the matrix. There are outliers in the matrix whose patterns
might be hidden by this color mapping. You can manually set the color
to `col` argument.
Use `suppressMessages()` to turn off this message.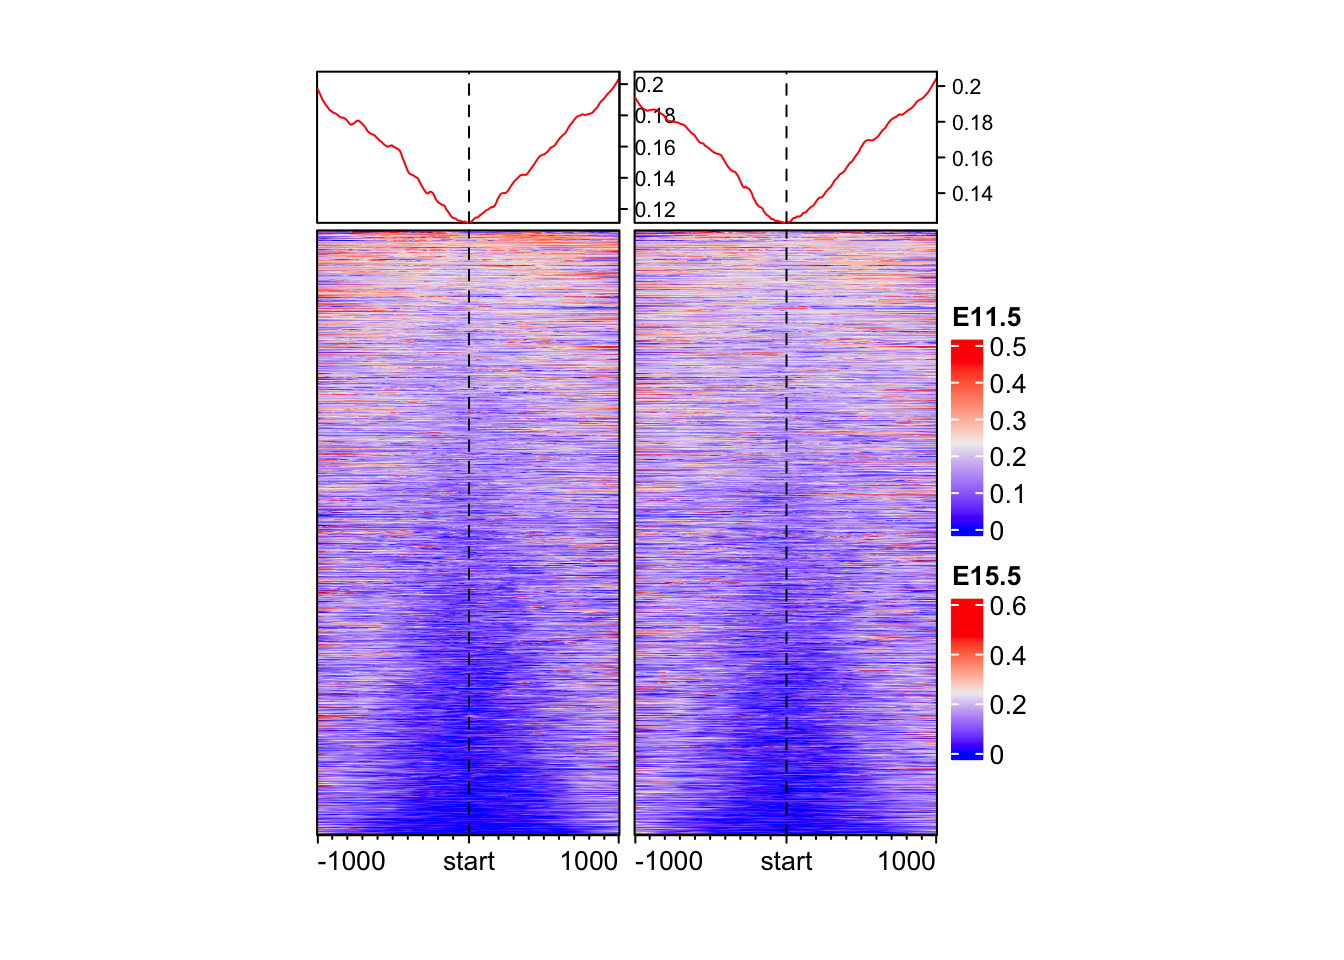
Important
We have not performed differential analysis for DNA methylation data. If you want, you can. Here, we are using DNA methylation as an observartory mark.