Exercise 6
Integrating ATAC and RNA sequencing data
Learning Objectives
By the end of this exercise, you will be able to:
- Understand the biological significance of different assays such as ATAC-seq, ChIP-seq for histone marks, DNA methylation, and RNA-seq, and how they relate to gene regulation.
- Process and integrate multi-omics data using SummarizedExperiment objects and annotation data.
- Identify and classify regulatory genomic regions (e.g., gained/lost enhancers, activated/repressed promoters) based on changes in chromatin accessibility, histone modifications, and gene expression.
- Visualize complex multi-omics data by generating heatmaps with the EnrichedHeatmap and ComplexHeatmap R packages, highlighting changes across developmental stages.
- Interpret integrated heatmaps to explore relationships between chromatin state, DNA methylation, and transcriptional output.
- Use custom functions to automate visualization workflows, adapting color scales and annotations for effective data presentation.
Load Libraries
| Assay | What It Measures | **Biological Insight* |
|---|---|---|
| ATAC-seq | Chromatin accessibility | Identifies open chromatin regions, such as promoters and enhancers. |
| ChIP-seq (H3K4me3) | Active promoter mark | Marks active promoters; often found at TSS (Transcription Start Sites). |
| ChIP-seq (H3K27ac) | Active enhancer/promoter | Marks active regulatory regions, especially enhancers. |
| ChIP-seq (H3K4me1) | Primed or poised enhancers | Marks enhancers that may be active or poised, not promoters. |
| ChIP-seq (H3K27me3) | Repressive regions | Marks silenced genes or developmental repression (Polycomb repression). |
| DNAme | DNA methylation (CpG sites) | Typically associated with gene silencing and heterochromatin. |
| RNA-seq | Gene expression | Final transcriptional output; mRNA abundance. |
Load required objects from previous exercises
Here we load the SummarizedExperiment for the ChIP-seq data
atac <- readRDS("data/atac_se.rds")
h3k4me3 <- readRDS("data/h3k4me3_se.rds")
h3k4me1 <- readRDS("data/h3k4me1_se.rds")
h3k27me3 <- readRDS("data/h3k27me3_se.rds")
h3k27ac <- readRDS("data/h3k27ac_se.rds")
rna <- readRDS("data/rna_se.rds")
rownames(colData(rna)) <- gsub(pattern = "\\.tsv.gz", replacement = "", x = rownames(colData(rna)))

overlap <- readRDS("output/overlap_anno.rds")

mat_ATAC <- readRDS("output/mat_atac.rds")
mat_RNA <- readRDS("output/mat_rna.rds")
mat_H3K4me3 <- readRDS("output/mat_h3k4me3.rds")
mat_H3K4me1 <- readRDS("output/mat_h3k4me1.rds")
mat_H3K27me3 <- readRDS("output/mat_h3k27me3.rds")
mat_H3K27ac <- readRDS("output/mat_h3k27ac.rds")
mat_BS <- readRDS("output/mat_bs.rds")
Regulatory regions
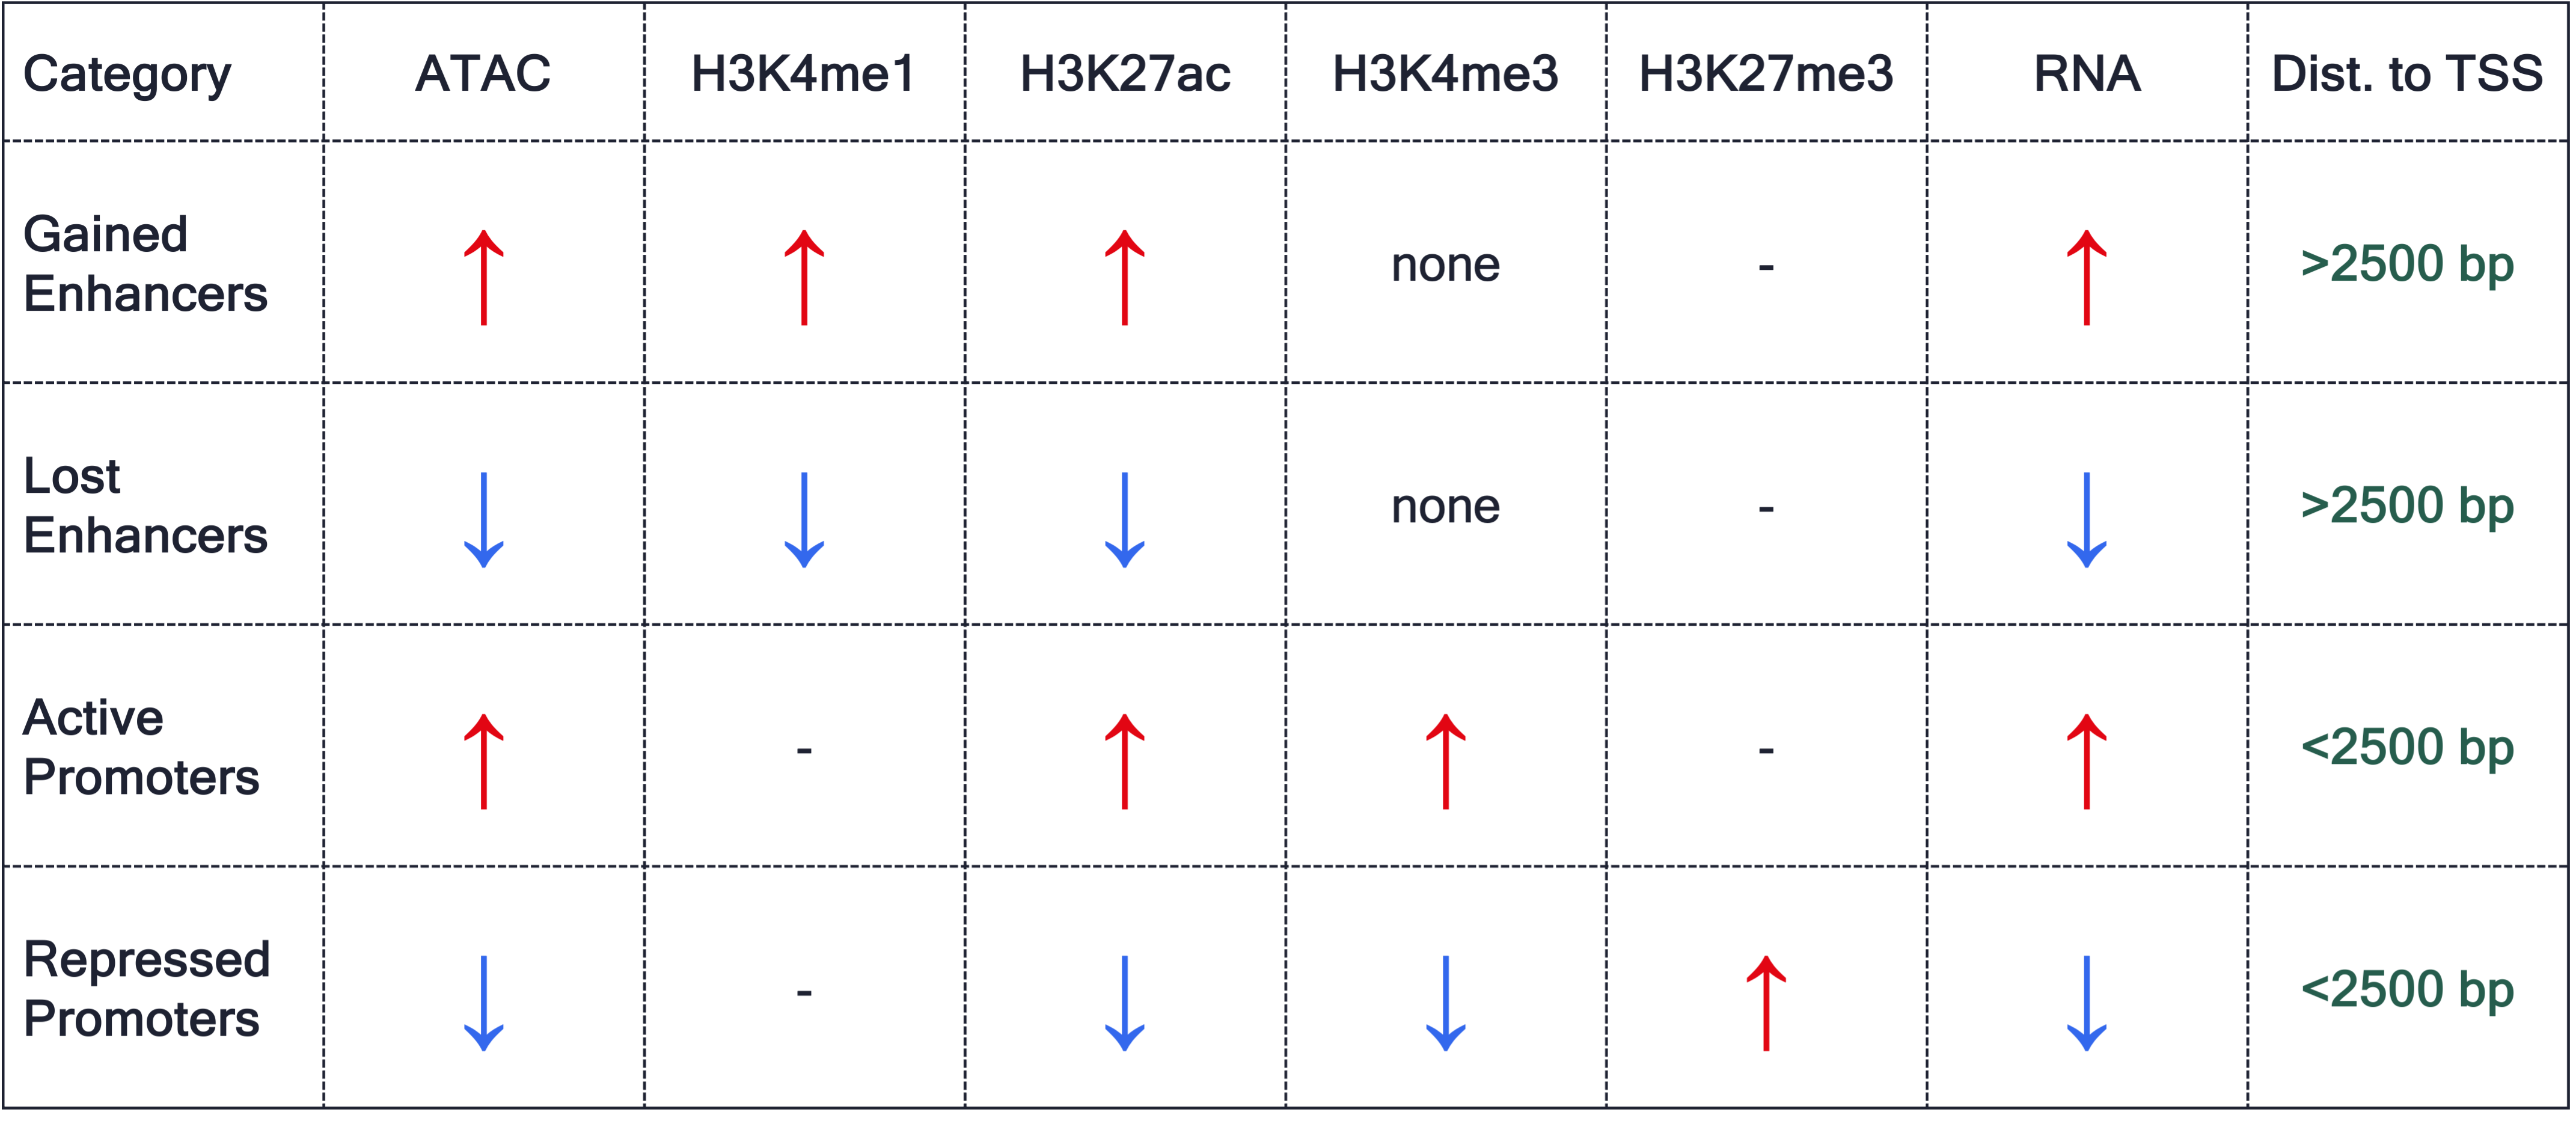
We will sub-categorized the regions from the Exercise 5 based on the above table.
Gained Enhancers (E15.5 > E11.5)
logFC_cols <- grep(pattern = "logFC", x = colnames(elementMetadata(overlap)))
mcols(overlap)[, logFC_cols] <- lapply(mcols(overlap)[, logFC_cols, drop = FALSE], function(x) {
  x[is.na(x)] <- 0
  return(x)
})

gained_enhancers <- overlap$ATAC_logFC > 0 &
  overlap$H3K4me1_logFC > 0 &
  overlap$H3K27ac_logFC > 0 &
  is.na(overlap$H3K4me3_annotation) &
  overlap$ATAC_distanceToTSS > 2500 &
  overlap$RNA_logFC > 0

overlap$ATAC_RNA[gained_enhancers] <- "Gained Enhancers"
Lost Enhancers (E15.5 < E11.5)
lost_enhancers <- overlap$ATAC_logFC < 0 &
  overlap$H3K4me1_logFC < 0 &
  overlap$H3K27ac_logFC < 0 &
  is.na(overlap$H3K4me3_annotation) &
  overlap$ATAC_distanceToTSS > 2500 &
  overlap$RNA_logFC < 0

overlap$ATAC_RNA[lost_enhancers] <- "Lost Enhancers"
Activated Promoters (E15.5 > E11.5)
active_promoters <- overlap$ATAC_logFC > 0 &
  overlap$H3K4me3_logFC > 0 &
  overlap$H3K27ac_logFC > 0 &
  overlap$ATAC_distanceToTSS < 2500 &
  overlap$RNA_logFC > 0

overlap$ATAC_RNA[active_promoters] <- "Active Promoters"
Repressed Promoters (E15.5 < E11.5)
repressed_promoters <- overlap$ATAC_logFC < 0 &
  overlap$H3K4me3_logFC < 0 &
  overlap$H3K27ac_logFC < 0 &
  overlap$H3K27me3_logFC > 0 &
  overlap$ATAC_distanceToTSS < 2500 &
  overlap$RNA_logFC < 0

overlap$ATAC_RNA[repressed_promoters] <- "Repressed Promoters"
Save the file
saveRDS(object = overlap, file = "output/overlap_anno2.rds")
EnrichedHeatmap + ComplexHeatmap
Our function from previous exercise
make_EH <- function(norm_mat, heatmap_cols = c("white", "red"), split_rows = NULL, hm_name, col_fill = "#ffcccc"){

  if(length(heatmap_cols) == 2){
    col_fun <- colorRamp2(quantile(norm_mat, c(0.01, 0.99), na.rm = T), heatmap_cols)
  } else if(length(heatmap_cols) == 3){
  col_fun <- colorRamp2(quantile(mat_BS$WGBS_11half, c(0.01, 0.5, 0.99), na.rm = T), heatmap_cols)
  } else{
    message("Please update function!")
  }

  vmin <- as.numeric(quantile(norm_mat, c(0.01), na.rm = T))
  vmax <- as.numeric(quantile(norm_mat, c(0.99), na.rm = T))
  vmid <- (vmin + vmax) / 2
  legend_ticks <- c(vmin, vmid, vmax)

EnrichedHeatmap(
  mat = norm_mat,
  name = hm_name,
  row_split = split_rows,
  col = col_fun,
  width = unit(2, "cm"),
  height = unit(8, "cm"),
  column_title = hm_name,
  column_title_gp = gpar(fontsize = 8, fill = col_fill),
  axis_name = c("-1kb", "mid", "1kb"),
  heatmap_legend_param = list(
    at = legend_ticks,
    legend_height = unit(0.5, "cm"),
    legend_width = unit(0.1, "cm"),
    labels = round(legend_ticks, digits = 1),
    title_gp = gpar(fontsize = 8),
    labels_gp = gpar(fontsize = 7)
  ),
  top_annotation = HeatmapAnnotation(
    lines = anno_enriched(
      height = unit(1, "cm"),
      axis_param = list(
        side = "right",
        facing = "inside",
        gp = gpar(
          fontsize = 7,
          lwd = 0.4
        )
      )
    )
  )
)
}
ATAC
atac_11h <- make_EH(norm_mat = mat_ATAC$ATAC_11half, hm_name = "AS-E11.5", col_fill = "#ffcccc")
atac_15h <- make_EH(norm_mat = mat_ATAC$ATAC_15half, hm_name = "AS-E15.5", col_fill = "#e6fff2")
H3K4me3
H3K4me1
H3K27me3
H3K27ac
Methylation
Annotation
 [1] "Active Promoters"    "Inc. Acc."           "Dec. Acc."
 [4] "Incongruent"         "Silent"              "Active"
 [7] "Repressed"           "Gained Enhancers"    "Lost Enhancers"
[10] "Repressed Promoters"
split_anno <- factor(split_anno, levels = unique(split_anno)[c(1,10,6,7,8,9,5,4,2,3)])
cols_an <- RColorBrewer::brewer.pal(n = length(unique(split_anno)), name = "Paired")
row_order_eh <- row_order(atac_11h)Warning: The heatmap has not been initialized. You might have different results
if you repeatedly execute this function, e.g. when row_km/column_km was
set. It is more suggested to do as `ht = draw(ht); row_order(ht)`.anno_hm <- Heatmap(
mat = split_anno,
col = cols_an,
name = "Annotation",
show_row_names = FALSE,
show_column_names = FALSE,
width = unit(2, "mm"),
height = unit(8, "cm"),
row_order = row_order_eh,
row_title_gp = gpar(fontsize = 0)
)There are 10 unique colors in the vector `col` and 10 unique values in
`matrix`. `Heatmap()` will treat it as an exact discrete one-to-one
mapping. If this is not what you want, slightly change the number of
colors, e.g. by adding one more color or removing a color.RNA
rna_hm <- Heatmap(matrix = mat_RNA,
        name = "RNA",
        cluster_columns = FALSE,
        cluster_rows = FALSE,
        na_col = "grey",
        row_order = row_order_eh,
        show_row_names = FALSE,
        show_column_names = FALSE,
        row_title_rot = 0,
        top_annotation = HeatmapAnnotation(
          df = colData(rna)[,2,drop = FALSE],
          annotation_name_gp = gpar(fontsize = 0)
        ),
        width = unit(2, "cm"),
        height = unit(18, "cm"),
        heatmap_legend_param = list(
          legend_height = unit(0.5, "cm"),
          legend_width = unit(0.1, "cm"),
          at = c(-10,0,10),
          title = "RNA",
          title_gp = gpar(fontsize = 8),
          labels_gp = gpar(fontsize = 7)
        )
)
Combine plots
ht_opt$TITLE_PADDING <- unit(1, "mm")
ht_opt$legend_gap <- unit(3, "mm")
ht_opt$legend_grid_height <- unit(2, "mm")
ht_opt$legend_grid_width <- unit(2, "mm")
ht_opt$HEATMAP_LEGEND_PADDING <- unit(1, "mm")
ht_opt$heatmap_border <- TRUE

draw(
  anno_hm +
    atac_11h + atac_15h +
    h3k4me3_11h + h3k4me3_15h +
    h3k4me1_11h + h3k4me1_15h +
    h3k27me3_11h + h3k27me3_15h +
    h3k27ac_11h + h3k27ac_15h +
    rna_hm +
    meth_11h + meth_15h,
  split = split_anno,
  merge_legend = FALSE,
  heatmap_legend_side = "bottom"
)pdf(file = "output/final_heatmap.pdf", width = 22, height = 17)
grid.newpage()
pushViewport(viewport(gp = gpar(lwd = 0.5)))
draw(
anno_hm +
atac_11h + atac_15h +
h3k4me3_11h + h3k4me3_15h +
h3k4me1_11h + h3k4me1_15h +
h3k27me3_11h + h3k27me3_15h +
h3k27ac_11h + h3k27ac_15h +
rna_hm +
meth_11h + meth_15h,
split = split_anno,
merge_legend = FALSE,
heatmap_legend_side = "bottom"
)Warning: `legend_height` you specified is too small, use the default minimal
height.
Warning: `legend_height` you specified is too small, use the default minimal
height.
Warning: `legend_height` you specified is too small, use the default minimal
height.
Warning: `legend_height` you specified is too small, use the default minimal
height.
Warning: `legend_height` you specified is too small, use the default minimal
height.
Warning: `legend_height` you specified is too small, use the default minimal
height.
Warning: `legend_height` you specified is too small, use the default minimal
height.
Warning: `legend_height` you specified is too small, use the default minimal
height.
Warning: `legend_height` you specified is too small, use the default minimal
height.
Warning: `legend_height` you specified is too small, use the default minimal
height.
Warning: `legend_height` you specified is too small, use the default minimal
height.
Warning: `legend_height` you specified is too small, use the default minimal
height.
Warning: `legend_height` you specified is too small, use the default minimal
height.
Warning: `legend_height` you specified is too small, use the default minimal
height.
Warning: `legend_height` you specified is too small, use the default minimal
height.
Warning: `legend_height` you specified is too small, use the default minimal
height.
Warning: `legend_height` you specified is too small, use the default minimal
height.
Warning: `legend_height` you specified is too small, use the default minimal
height.
Warning: `legend_height` you specified is too small, use the default minimal
height.
Warning: `legend_height` you specified is too small, use the default minimal
height.
Warning: `legend_height` you specified is too small, use the default minimal
height.
Warning: `legend_height` you specified is too small, use the default minimal
height.
Warning: `legend_height` you specified is too small, use the default minimal
height.
Warning: `legend_height` you specified is too small, use the default minimal
height.
Warning: `legend_height` you specified is too small, use the default minimal
height.
Warning: `legend_height` you specified is too small, use the default minimal
height.
Warning: `legend_height` you specified is too small, use the default minimal
height.
Warning: `legend_height` you specified is too small, use the default minimal
height.
Warning: `legend_height` you specified is too small, use the default minimal
height.
Warning: `legend_height` you specified is too small, use the default minimal
height.
Warning: `legend_height` you specified is too small, use the default minimal
height.
Warning: `legend_height` you specified is too small, use the default minimal
height.
Warning: `legend_height` you specified is too small, use the default minimal
height.
Warning: `legend_height` you specified is too small, use the default minimal
height.
Warning: `legend_height` you specified is too small, use the default minimal
height.
Warning: `legend_height` you specified is too small, use the default minimal
height.
Warning: `legend_height` you specified is too small, use the default minimal
height.
Warning: `legend_height` you specified is too small, use the default minimal
height.
Warning: `legend_height` you specified is too small, use the default minimal
height.popViewport()
dev.off()quartz_off_screen
2 png(filename = "output/final_heatmap.png", width = 27, height = 22, units = "in", res = 330)
grid.newpage()
pushViewport(viewport(gp = gpar(lwd = 0.5)))
draw(
anno_hm +
atac_11h + atac_15h +
h3k4me3_11h + h3k4me3_15h +
h3k4me1_11h + h3k4me1_15h +
h3k27me3_11h + h3k27me3_15h +
h3k27ac_11h + h3k27ac_15h +
rna_hm +
meth_11h + meth_15h,
split = split_anno,
merge_legend = FALSE,
heatmap_legend_side = "bottom"
)Warning: `legend_height` you specified is too small, use the default minimal
height.
Warning: `legend_height` you specified is too small, use the default minimal
height.
Warning: `legend_height` you specified is too small, use the default minimal
height.
Warning: `legend_height` you specified is too small, use the default minimal
height.
Warning: `legend_height` you specified is too small, use the default minimal
height.
Warning: `legend_height` you specified is too small, use the default minimal
height.
Warning: `legend_height` you specified is too small, use the default minimal
height.
Warning: `legend_height` you specified is too small, use the default minimal
height.
Warning: `legend_height` you specified is too small, use the default minimal
height.
Warning: `legend_height` you specified is too small, use the default minimal
height.
Warning: `legend_height` you specified is too small, use the default minimal
height.
Warning: `legend_height` you specified is too small, use the default minimal
height.
Warning: `legend_height` you specified is too small, use the default minimal
height.
Warning: `legend_height` you specified is too small, use the default minimal
height.
Warning: `legend_height` you specified is too small, use the default minimal
height.
Warning: `legend_height` you specified is too small, use the default minimal
height.
Warning: `legend_height` you specified is too small, use the default minimal
height.
Warning: `legend_height` you specified is too small, use the default minimal
height.
Warning: `legend_height` you specified is too small, use the default minimal
height.
Warning: `legend_height` you specified is too small, use the default minimal
height.
Warning: `legend_height` you specified is too small, use the default minimal
height.
Warning: `legend_height` you specified is too small, use the default minimal
height.
Warning: `legend_height` you specified is too small, use the default minimal
height.
Warning: `legend_height` you specified is too small, use the default minimal
height.
Warning: `legend_height` you specified is too small, use the default minimal
height.
Warning: `legend_height` you specified is too small, use the default minimal
height.
Warning: `legend_height` you specified is too small, use the default minimal
height.
Warning: `legend_height` you specified is too small, use the default minimal
height.
Warning: `legend_height` you specified is too small, use the default minimal
height.
Warning: `legend_height` you specified is too small, use the default minimal
height.
Warning: `legend_height` you specified is too small, use the default minimal
height.
Warning: `legend_height` you specified is too small, use the default minimal
height.
Warning: `legend_height` you specified is too small, use the default minimal
height.
Warning: `legend_height` you specified is too small, use the default minimal
height.
Warning: `legend_height` you specified is too small, use the default minimal
height.
Warning: `legend_height` you specified is too small, use the default minimal
height.
Warning: `legend_height` you specified is too small, use the default minimal
height.
Warning: `legend_height` you specified is too small, use the default minimal
height.
Warning: `legend_height` you specified is too small, use the default minimal
height.popViewport()
dev.off()quartz_off_screen
2 Question
Look at the plot carefully and try to understand patterns. Can you confirm from the plot that the plot is correct for the Active Promoters?
Important
You can make all possible categories from this overlapMatrix. Feel free to make more categories.
Bonus
Important
A reference guide for integrating multiomics data is provided here: Reference Guide