Exercise 5
Integrating ATAC and RNA sequencing data
Learning Objectives
By the end of this exercise, you will be able to:
- Load and manipulate
SummarizedExperimentobjects containing ATAC-seq and RNA-seq data. - Understand how to categorize genomic regions based on combined accessibility (ATAC) and expression (RNA) changes.
- Annotate genomic regions with meaningful biological categories such as “Active”, “Repressed”, “Silent”, and others.
- Use the
ComplexHeatmapandEnrichedHeatmappackages to visualize multi-omics data with customizable heatmaps. - Implement and modify heatmap functions to integrate and compare ATAC and RNA signal patterns across samples.
- Adjust factor levels to control the order of categories in heatmaps for clear biological interpretation.
- Combine multiple heatmaps and annotations for integrative visualization of chromatin accessibility and gene expression.
Load Libraries
Load required objects from previous exercises
Here we load the SummarizedExperiment for the ChIP-seq data
Add possible genomic regions for ATAC and RNA
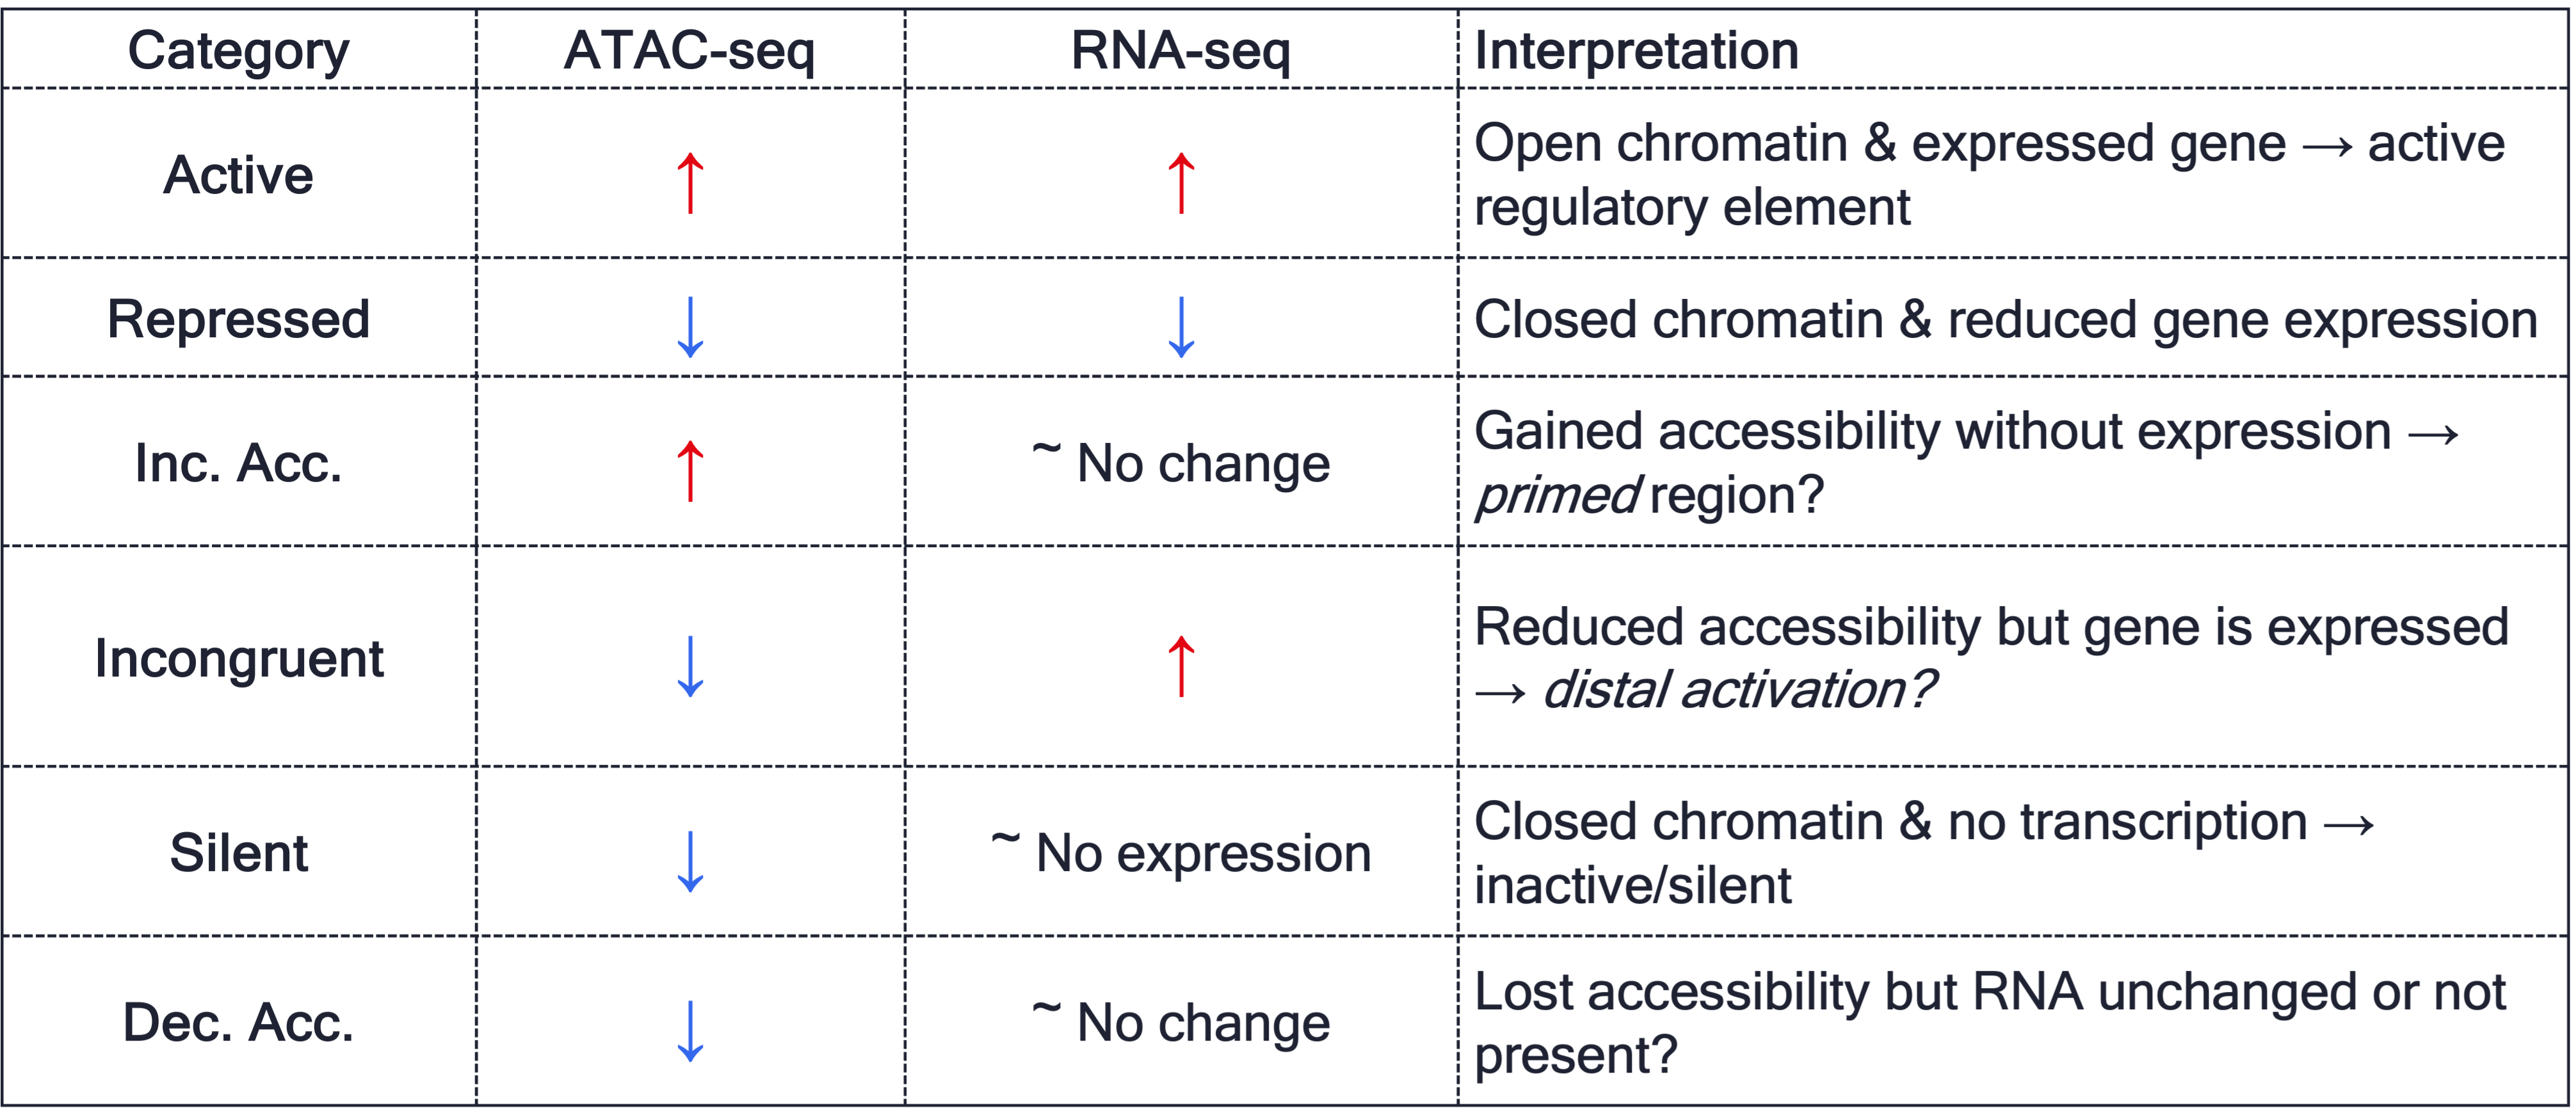
Based on the table above, we will assign categories to the overlapMatrix.
overlap$ATAC_RNA <- NULL

# Increased accessibility and increased expression
overlap$ATAC_RNA[overlap$ATAC_logFC > 0 & overlap$RNA_logFC > 0] <- "Active"

# Increased accessibility and decreased expression
overlap$ATAC_RNA[overlap$ATAC_logFC > 0 & overlap$RNA_logFC < 0] <- "Repressed"

# Decreased accessibility and decreased expression
overlap$ATAC_RNA[overlap$ATAC_logFC < 0 & overlap$RNA_logFC < 0] <- "Silent"

# Decreased accessibility and increased expression (incongruent)
overlap$ATAC_RNA[overlap$ATAC_logFC < 0 & overlap$RNA_logFC > 0] <- "Incongruent"

# Accessibility changes, but no gene expression info
overlap$ATAC_RNA[overlap$ATAC_logFC < 0 & is.na(overlap$RNA_logFC)] <- "Dec. Acc."
overlap$ATAC_RNA[overlap$ATAC_logFC > 0 & is.na(overlap$RNA_logFC)] <- "Inc. Acc."

saveRDS(object = overlap, file = "output/overlap_anno.rds")
EnrichedHeatmap + ComplexHeatmap
Our function from previous exercise
make_EH <- function(norm_mat, heatmap_cols = c("white", "red"), split_rows = NULL, hm_name, col_fill = "#ffcccc"){
  col_fun <- colorRamp2(quantile(norm_mat, c(0.01, 0.99)), heatmap_cols)

  vmin <- as.numeric(quantile(norm_mat, c(0.01)))
  vmax <- as.numeric(quantile(norm_mat, c(0.99)))
  vmid <- (vmin + vmax) / 2
  legend_ticks <- c(vmin, vmid, vmax)

EnrichedHeatmap(
  mat = norm_mat,
  name = hm_name,
  row_split = split_rows,
  col = col_fun,
  width = unit(2, "cm"),
  height = unit(8, "cm"),
  column_title = hm_name,
  column_title_gp = gpar(fontsize = 8, fill = col_fill),
  axis_name = c("-1kb", "mid", "1kb"),
  heatmap_legend_param = list(
    at = legend_ticks,
    legend_height = unit(0.5, "cm"),
    legend_width = unit(0.1, "cm"),
    labels = round(legend_ticks, digits = 1),
    title_gp = gpar(fontsize = 8),
    labels_gp = gpar(fontsize = 7)
  ),
  top_annotation = HeatmapAnnotation(
    lines = anno_enriched(
      height = unit(1, "cm"),
      axis_param = list(
        side = "right",
        facing = "inside",
        gp = gpar(
          fontsize = 7,
          lwd = 0.4
        )
      )
    )
  )
)
}
ATAC
     peak_1      peak_2      peak_3      peak_4      peak_5      peak_6
   "Active" "Inc. Acc." "Dec. Acc." "Dec. Acc." "Inc. Acc." "Dec. Acc."
cols_an <- RColorBrewer::brewer.pal(n = length(unique(split_anno)), name = "Set1")
eh_11h <- make_EH(norm_mat = mat_ATAC$ATAC_11half, hm_name = "AS-E11.5", col_fill = "#ffcccc")
eh_15h <- make_EH(norm_mat = mat_ATAC$ATAC_15half, hm_name = "AS-E15.5", col_fill = "#e6fff2")
row_order_eh <- row_order(eh_11h)Warning: The heatmap has not been initialized. You might have different results
if you repeatedly execute this function, e.g. when row_km/column_km was
set. It is more suggested to do as `ht = draw(ht); row_order(ht)`.anno_hm <- Heatmap(
mat = split_anno,
col = cols_an,
name = "Annotation",
show_row_names = FALSE,
show_column_names = FALSE,
width = unit(2, "mm"),
height = unit(8, "cm"),
row_order = row_order_eh,
row_title_gp = gpar(fontsize = 0)
)There are 6 unique colors in the vector `col` and 6 unique values in
`matrix`. `Heatmap()` will treat it as an exact discrete one-to-one
mapping. If this is not what you want, slightly change the number of
colors, e.g. by adding one more color or removing a color.draw(anno_hm + eh_11h + eh_15h, split = split_anno, merge_legend = TRUE)Warning: `legend_height` you specified is too small, use the default minimal
height.Warning: `legend_height` you specified is too small, use the default minimal
height.
Warning: `legend_height` you specified is too small, use the default minimal
height.
Warning: `legend_height` you specified is too small, use the default minimal
height.
Warning: `legend_height` you specified is too small, use the default minimal
height.
Warning: `legend_height` you specified is too small, use the default minimal
height.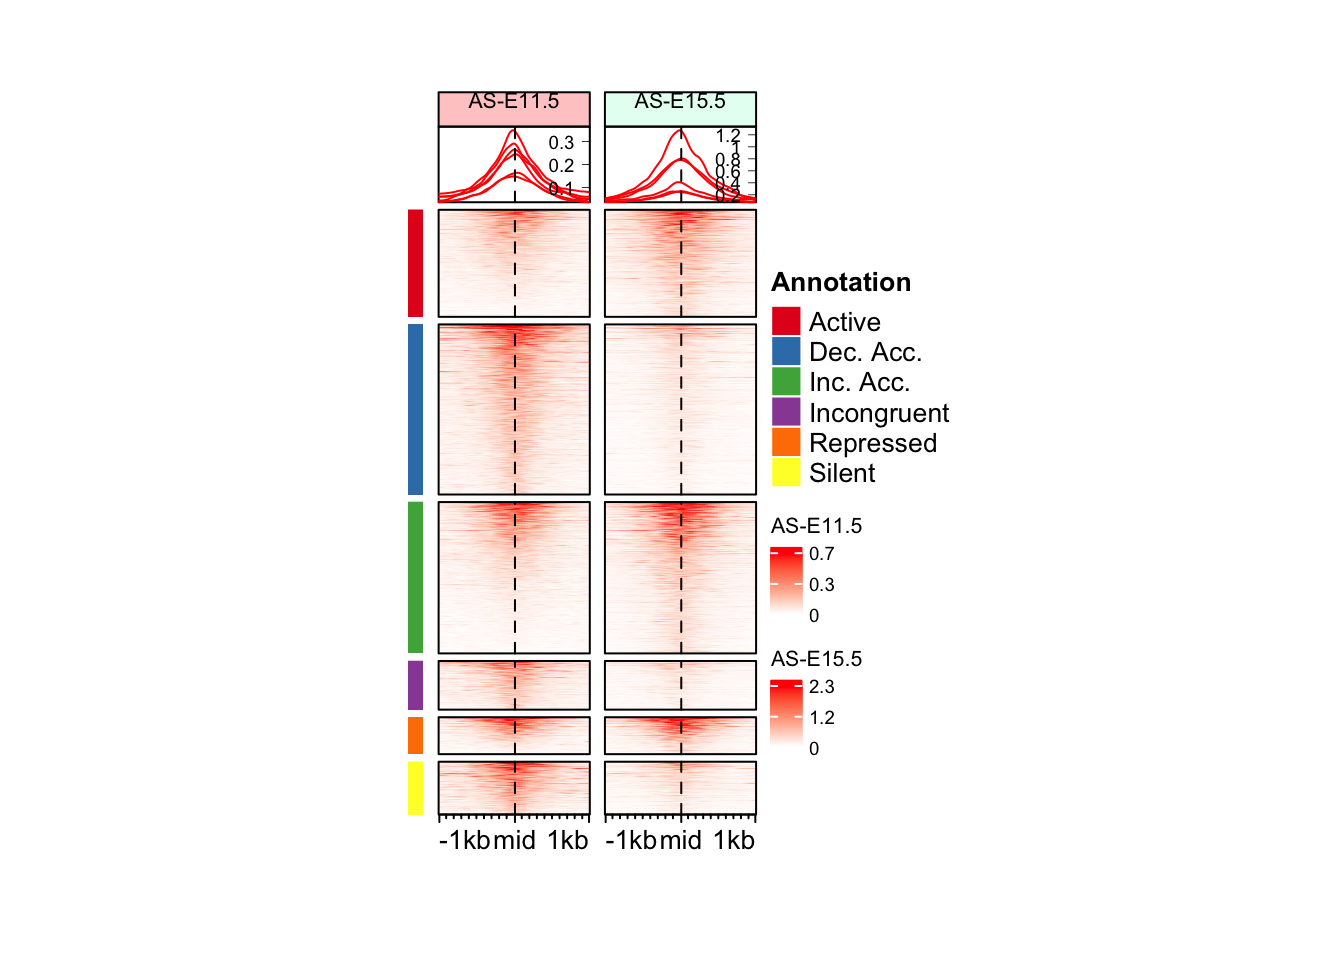
RNA
rna_hm <- Heatmap(matrix = mat_RNA,
name = "RNA",
cluster_columns = FALSE,
cluster_rows = FALSE,
na_col = "grey",
row_order = row_order_eh,
show_row_names = FALSE,
show_column_names = FALSE,
row_title_rot = 0,
top_annotation = HeatmapAnnotation(
df = colData(rna)[,2,drop = FALSE],
annotation_name_gp = gpar(fontsize = 0)
),
width = unit(2, "cm"),
height = unit(8, "cm"),
heatmap_legend_param = list(
legend_height = unit(0.5, "cm"),
legend_width = unit(0.1, "cm"),
at = c(-10,0,10),
title = "RNA",
title_gp = gpar(fontsize = 8),
labels_gp = gpar(fontsize = 7)
)
)
draw(rna_hm, split = split_anno, merge_legend = TRUE)Warning: `legend_height` you specified is too small, use the default minimal
height.
Warning: `legend_height` you specified is too small, use the default minimal
height.
Warning: `legend_height` you specified is too small, use the default minimal
height.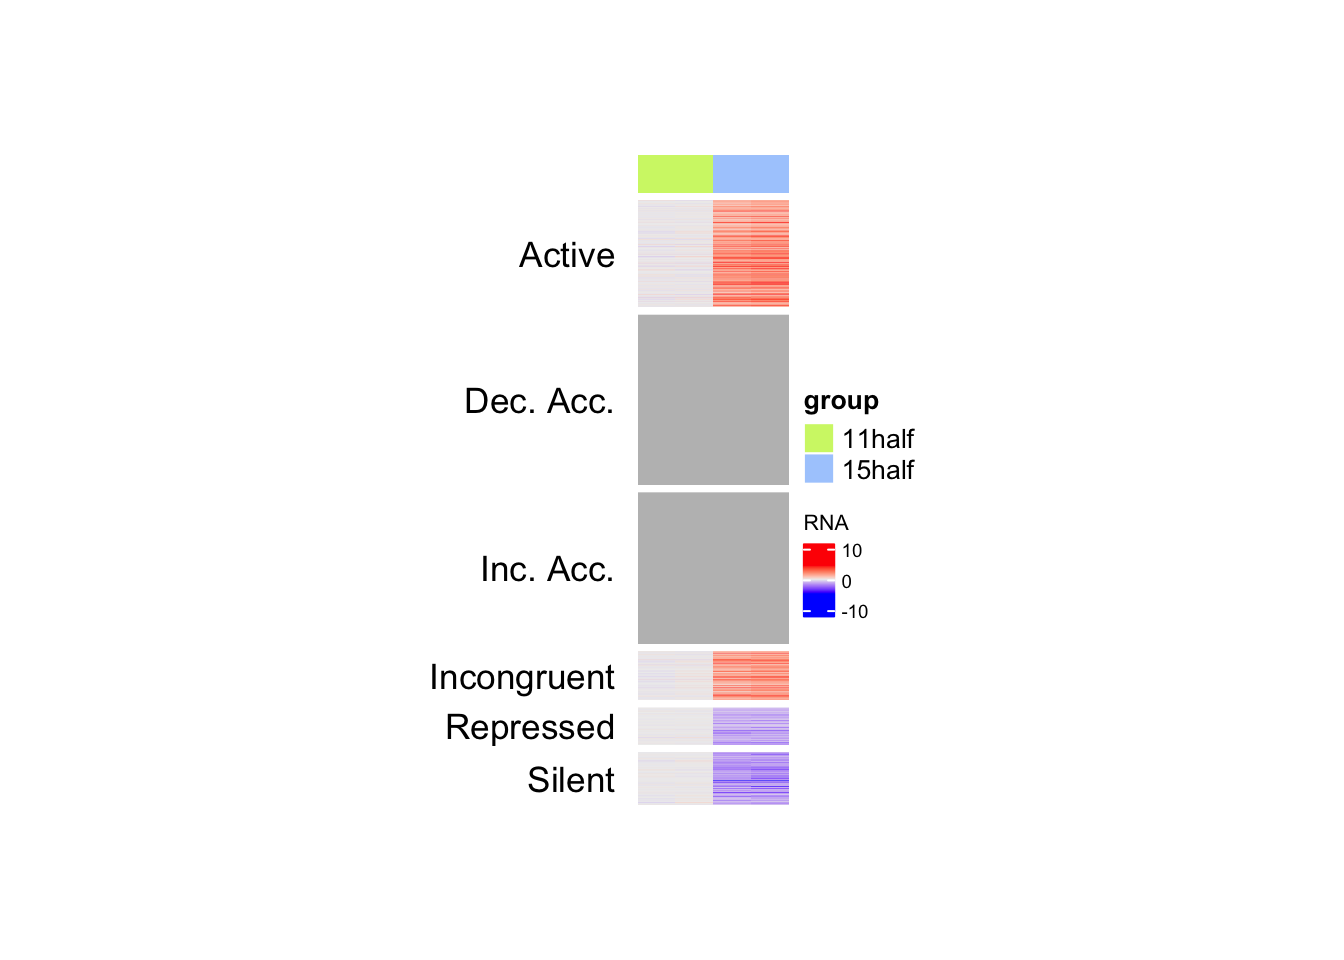
Combine plots
draw(anno_hm + eh_11h + eh_15h + rna_hm, split = split_anno, merge_legend = TRUE)Warning: `legend_height` you specified is too small, use the default minimal
height.
Warning: `legend_height` you specified is too small, use the default minimal
height.
Warning: `legend_height` you specified is too small, use the default minimal
height.
Warning: `legend_height` you specified is too small, use the default minimal
height.
Warning: `legend_height` you specified is too small, use the default minimal
height.
Warning: `legend_height` you specified is too small, use the default minimal
height.
Warning: `legend_height` you specified is too small, use the default minimal
height.
Warning: `legend_height` you specified is too small, use the default minimal
height.
Warning: `legend_height` you specified is too small, use the default minimal
height.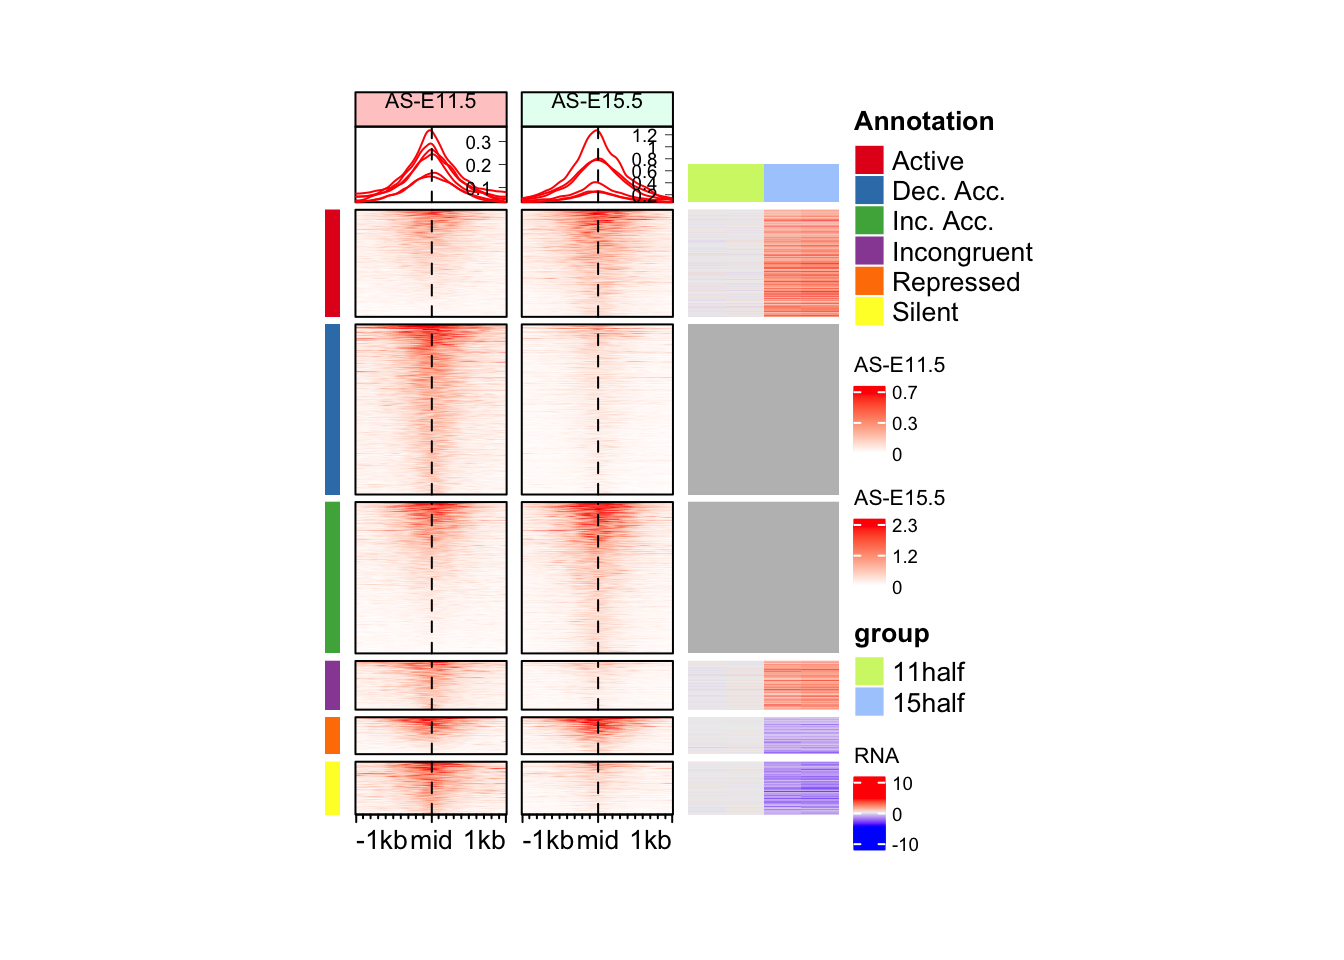
Question
Can you change order of the regions? 1. Active 2. Repressed 3. Silent 4. Incongruent 5. Dec. Acc. 6. Inc. Acc.
Hint: You would have to change the factor levels of split_anno.
Answer
We have to re-make the annotation heatmap. draw function takes order from first object.
unique(split_anno)[1] "Active" "Inc. Acc." "Dec. Acc." "Incongruent" "Silent"
[6] "Repressed" split_anno <- factor(split_anno, levels = unique(split_anno)[c(1,6,5,4,2,3)])
anno_hm <- Heatmap(
  mat = split_anno,
  col = cols_an,
  name = "Annotation",
  show_row_names = FALSE,
  show_column_names = FALSE,
  width = unit(2, "mm"),
  height = unit(8, "cm"),
  row_order = row_order_eh,
  row_title_gp = gpar(fontsize = 0)
)
There are 6 unique colors in the vector `col` and 6 unique values in
`matrix`. `Heatmap()` will treat it as an exact discrete one-to-one
mapping. If this is not what you want, slightly change the number of
colors, e.g. by adding one more color or removing a color.draw(anno_hm + eh_11h + eh_15h + rna_hm, split = split_anno, merge_legend = FALSE)Warning: `legend_height` you specified is too small, use the default minimal
height.
Warning: `legend_height` you specified is too small, use the default minimal
height.
Warning: `legend_height` you specified is too small, use the default minimal
height.
Warning: `legend_height` you specified is too small, use the default minimal
height.
Warning: `legend_height` you specified is too small, use the default minimal
height.
Warning: `legend_height` you specified is too small, use the default minimal
height.
Warning: `legend_height` you specified is too small, use the default minimal
height.
Warning: `legend_height` you specified is too small, use the default minimal
height.
Warning: `legend_height` you specified is too small, use the default minimal
height.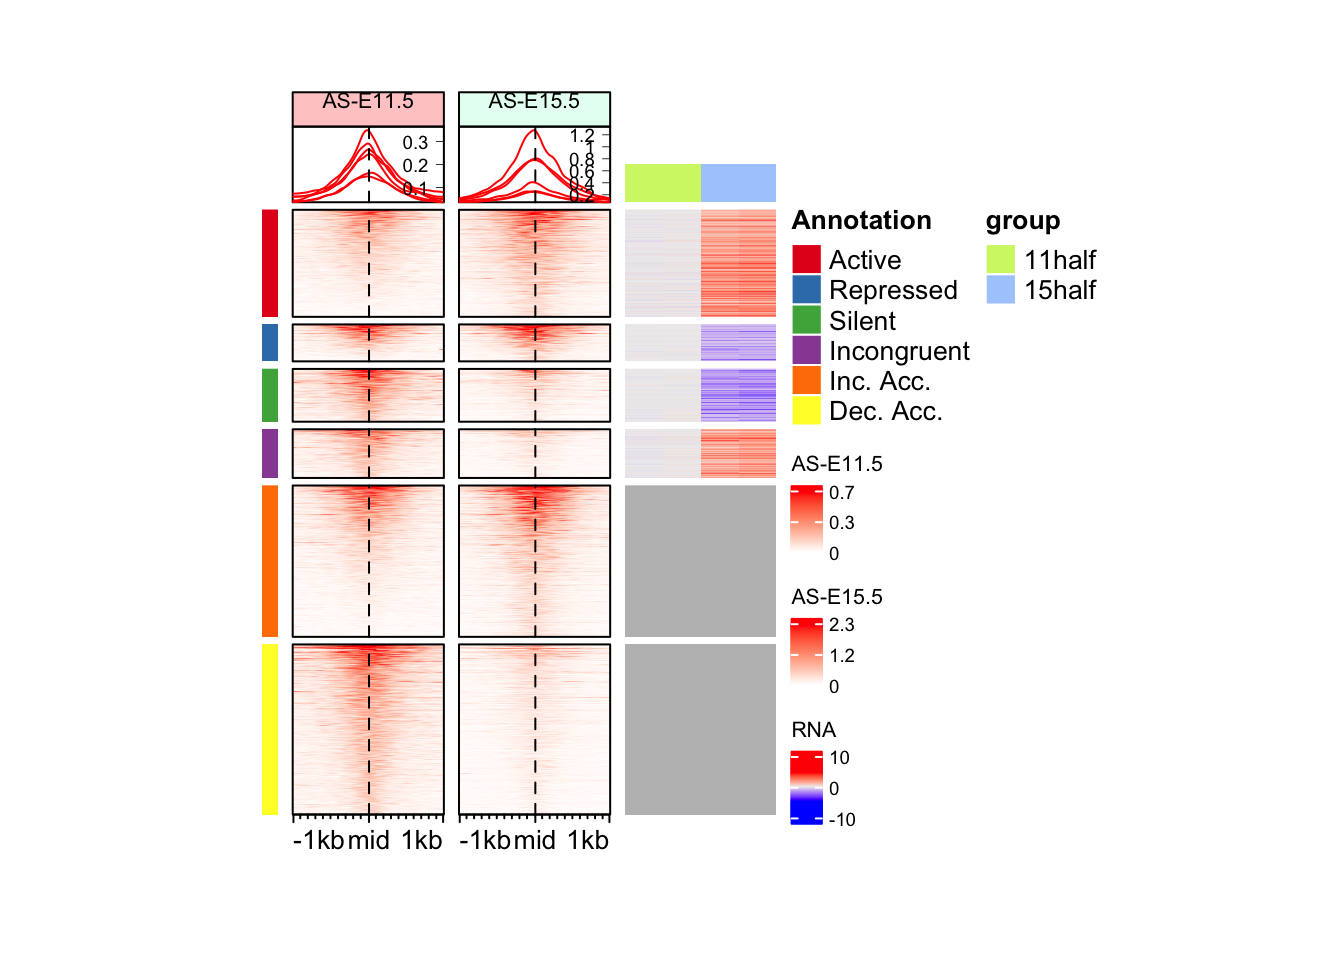
Important
To make the plots a bit prettier, you can run these codes before making the plot. You only need to run these once while you are in an R session, not before making every plot.